Quantcast
Channel: Stories by Franck Pachot on Medium
Viewing all 515 articles
Browse latest View live

High CPU usage in docker-proxy with chatty database application? Disable userland-proxy!

$
0
0

Or just keep database and application co-located :)

It is well-known from the get-go, but very often overlooked because of ignorance or laziness: the database application must be co-located with the database server. Row-by-row roundtrips between the application and the database are expensive. Not only due to the network latency, but also because of the many CPU cycles wasted to switch the context between the two engines, or the two processes, and maybe the two servers.

In modern architectures, with microservices and containers, this means that a business service must be implemented in one microservice containing the business logic and the business data. Separating the application and the database into two microservices is a wrong design, non-efficient, non-scalable, and also non-green because of the unnecessary CPU usage.

Docker

I was building a new demo for this, as in the previous post, where I compare running the procedural code in the client or the server side of the database. When I was running my database in a Docker container, I’ve seen that the bad performance I wanted to show was even worse than expected:

  • the symptom was high CPU usage in “docker-proxy” process
  • the cause was that I’m using the default Docker userland proxy

Here is the related Twitter thread. Thanks to @G_Ceresa, @ochoa_marcelo, and @ofirm for the quick replies about the cause and solution:

This post is a replay of the issue, with PostgreSQL as the database and PgBench as the client application. There’s a summary at the end, but I like to show all the steps.

Setup with PostgreSQL

I got the issue with an Oracle database, but I reproduced it with PostgreSQL. I start with a default docker 18.09 installation on CentOS 7.6 and 4 cores.

yum -y install docker-ce
systemctl start docker

I have the following docker-compose to get a client and server container:

version: '3.1'
services:
server:
image: postgres:latest
restart: always
environment:
POSTGRES_PASSWORD: demo
POSTGRES_DB: postgres
POSTGRES_INITDB_ARGS:
POSTGRES_INITDB_WALDIR:
PGDATA: /var/lib/postgresql/data
ports:
- 5432:5432
client:
image: postgres:latest
restart: always
environment:
PGPASSWORD: demo
links:
- server

In addition to that, as I want to run the clinet (pgbench) from outside, I’ve installed it on the host:

yum install -y postgresql-contrib

I create the containers and initialize PgBench with a small database so that everything is in memory as I don’t want I/O latency there:

docker-compose -f crosscontainerpgbench up -d --remove-orphans
docker exec -i crosscontainerpgbench_server_1 psql -U postgres -e <<'SQL'
drop database if exists demo;
create database demo;
SQL
docker exec -i crossconainerpgbench_server_1 pgbench -i -s 5 -U postgres demo

Test with pgbench — default Docker configuration

I’ll simply run a select-only (I don’t want disk I/O in order to have predictable results) workload with 5 clients:

pgbench -c 5 -j 1 -t 100000 -S -M prepared

I’ll run that from:

  • the DB server container, as if all is embedded in the same service
  • the client container, as if I have two containers for DB and application
  • the host, like when the application is running outside of the docker server

I’ll compare the transactions per second, and have a look at the CPU usage.

Application in the same container

Here is the run from the database server container:

+ docker exec -i crosscontainerpgbench_server_1 pgbench -c 5 -j 1 -t 100000 -S -M prepared -h localhost -U postgres demo
starting vacuum...end.
transaction type: <builtin: select only>
scaling factor: 5
query mode: prepared
number of clients: 5
number of threads: 1
number of transactions per client: 100000
number of transactions actually processed: 500000/500000
latency average = 0.286 ms
tps = 17510.332823 (including connections establishing)
tps = 17512.433838 (excluding connections establishing)

Application in another container

Here is the run from the client container through a network link to the server one:

+ docker exec -i crossconainerpgbench_client_1 pgbench -c 5 -j 1 -t 100000 -S -M prepared -h server -U postgres demo
starting vacuum...end.
transaction type: <builtin: select only>
scaling factor: 5
query mode: prepared
number of clients: 5
number of threads: 1
number of transactions per client: 100000
number of transactions actually processed: 500000/500000
latency average = 0.358 ms
tps = 13964.823706 (including connections establishing)
tps = 13966.547260 (excluding connections establishing)

This is a lower transaction per second rate when not running from the same container.

Application outside of any container

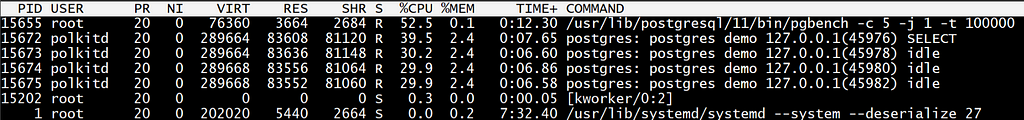
Here is the run from the host where the 5432 port is exposed:

+ pgbench -c 5 -j 1 -t 100000 -S -M prepared -h localhost -U postgres demo
starting vacuum...end.
transaction type: SELECT only
scaling factor: 5
query mode: prepared
number of clients: 5
number of threads: 1
number of transactions per client: 100000
number of transactions actually processed: 500000/500000
tps = 10803.986896 (including connections establishing)
tps = 10810.876728 (excluding connections establishing)

this is very bad performance when compared to the previous ones. Here is what TOP is sowing during the execution:

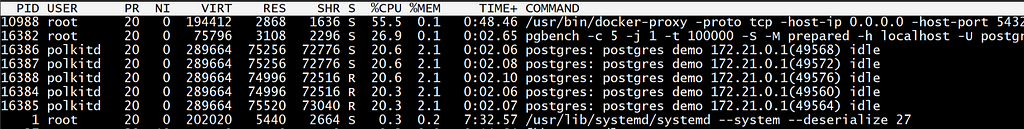
This docker-proxy is a userland proxy implemented by Docker. It is obviously not efficient given the amount of CPU resource required to just copy the network messages between processes.

Test with pgbench —without the Docker proxy

Now, thanks to the replies to my tweet, I got this default (legacy) behavior explained. Docker runs this process as a workaround for old bugs, but we can disable it.

I’ve added the following in /etc/docker/daemon.json and restarted docker:

{
"userland-proxy": false
}

Now, the port redirection is ensured by iptables only:

# iptables -t nat -L -n -v | grep NAT
    0     0 DNAT       tcp  --  !br-86c9e5013bd1 *       0.0.0.0/0            0.0.0.0/0            tcp dpt:5432 to:172.21.0.2:5432

Yes, as scary as it sounds, docker can manipulate your iptables without asking you. Remember that you run it as root… so be careful.

Now, same tests as before…

Application in the same container

From the database server container itself:

+ docker exec -i crossconainerpgbench_server_1 pgbench -c 5 -j 1 -t 100000 -S -M prepared -h localhost -U postgres demo
starting vacuum...end.
transaction type: <builtin: select only>
scaling factor: 5
query mode: prepared
number of clients: 5
number of threads: 1
number of transactions per client: 100000
number of transactions actually processed: 500000/500000
latency average = 0.274 ms
tps = 18218.661669 (including connections establishing)
tps = 18220.944898 (excluding connections establishing)

Application in another container

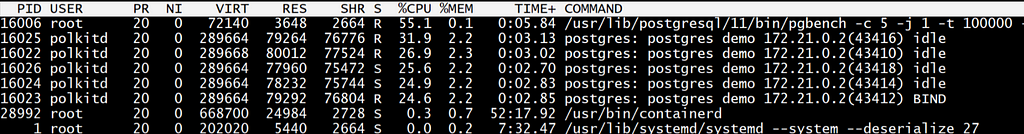
From the client container:

+ docker exec -i crossconainerpgbench_client_1 pgbench -c 5 -j 1 -t 100000 -S -M prepared -h server -U postgres demo
starting vacuum...end.
transaction type: <builtin: select only>
scaling factor: 5
query mode: prepared
number of clients: 5
number of threads: 1
number of transactions per client: 100000
number of transactions actually processed: 500000/500000
latency average = 0.323 ms
tps = 15497.325700 (including connections establishing)
tps = 15499.077232 (excluding connections establishing)

Application outside of any container

From the host, without the userland proxy. Note that I use the IPv4 address for localhost here because where connecting to localhost iptable was dropping the packets:

+ pgbench -c 5 -j 1 -t 100000 -S -M prepared -h 127.0.0.1 -U postgres demo
starting vacuum...end.
transaction type: SELECT only
scaling factor: 5
query mode: prepared
number of clients: 5
number of threads: 1
number of transactions per client: 100000
number of transactions actually processed: 500000/500000
tps = 16540.617239 (including connections establishing)
tps = 16552.098558 (excluding connections establishing)

This is correct, even better than when running from another container, but of course lower than when running in the same container.

In summary…

There’s a huge difference when this ‘docker-proxy’ is not running in the middle. Now, all pgbench runs are in the same ballpark, within 10%.

I have run the same tests in a loop in order to get an average. First, here is the standard deviation that I prefer to check because I’m not familiar enough with pgbench (and docker) performance predictability:

Standard Deviation for the preceding results

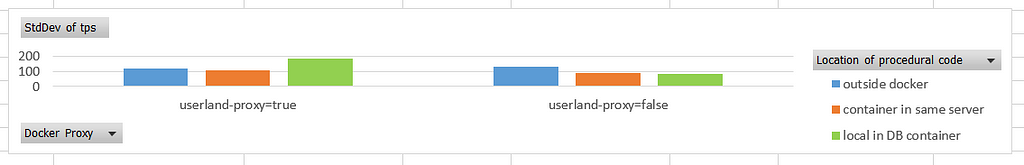
And here the results showing the average transactions-per-second with both settings for the docker proxy, and with different colocation of pgbench and DB server: on the docker host in blue, in a different docker container in orange, within the same container in green:

PgBench TPS depending on colocation with the DB and userland proxy

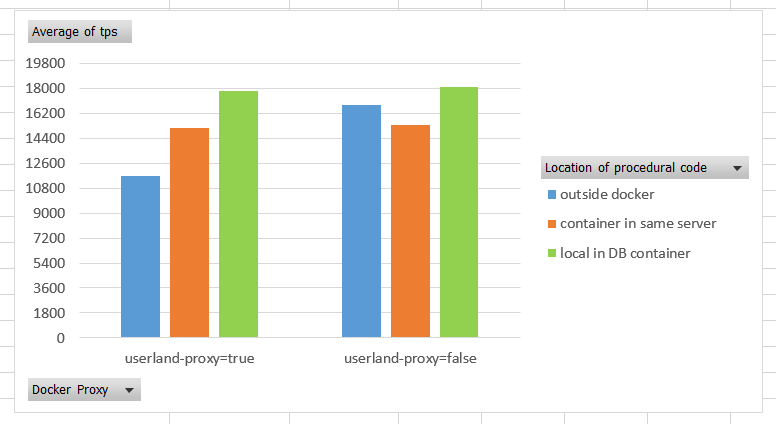
It looks like keeping the default value for ‘userland-proxy’ is never good. It forces all external network communication to go through this inefficient process. The performance here slows down to 40% when connecting from outside.

The most important is that even with the ‘userland proxy’ disabled, we see a 10% degradation when not running the application in the same container as the database. There’s no magic: the more physical layers you add, the worst performance you get. It can be a small overhead (when the layer is an optimal virtualization) or a huge waste of CPU cycles. Microservices and logical layers are good for the development organization. But when it comes to the platform dependent implementation, colocation is the key to scalability. Build small services, but run them colocated: either the database is embedded in the container, or the procedural code is executed in the database.

I’m talking about this at Riga Dev Days — “Microservices: Get Rid of Your DBA and Send the DB into Burnout”:

SQL Sessions at RigaDevDays

Feel free to comment on Twitter https://twitter.com/franckpachot


Adding JDBC driver property in SQL Developer connecting to MySQL

$
0
0

I suppose you get it there because this kind of error was properly indexed by Google:

Status : Failure -Test failed: The server time zone value 'CEST' is unrecognized or represents more than one time zone. You must configure either the server or JDBC driver (via the serverTimezone configuration property) to use a more specifc time zone value if you want to utilize time zone support.

However, this trick works if you want to add any property to the JDBC URL string when connecting with Oracle SQL Developer, which provides no other way to add properties.

The trick is JDBC URL Injection after the port. When connecting to port 5501 I set the following in the ‘port’ field:

5501/?serverTimezone=UTC#

like this:

which finally will expand to:

jdbc:mysql://myhost:5501/?serverTimezone=UTC#/information_schema

And get connected probably because of few bugs on both side, so not sure it works on all versions 😎

I added a dummy ‘#’ because the parser includes the ‘/’ if I don’t and I get:

Status : Failure -Test failed: No timezone mapping entry for 'UTC/information_schema'

So, with this additional ‘/?serverTimezone=UTC#’, here is the connection information displayed by a ‘show jdbc’:

-- Database Info --
Database Product Name: MySQL
Database Product Version: 5.7.15-log
Database Major Version: 5
Database Minor Version: 7
-- Driver Info --
Driver Name: MySQL Connector/J
Driver Version: mysql-connector-java-8.0.13 (Revision: 66459e9d39c8fd09767992bc592acd2053279be6)
Driver Major Version: 8
Driver Minor Version: 0
Driver URL: jdbc:mysql://myhost:5501/?serverTimezone=UTC#/information_schema
Driver Location: Unable to parse URL: bundleresource://271.fwk457998670/oracle/jdbc/OracleDriver.class

19c EZCONNECT and Wallet (Easy Connect and External Password File)

$
0
0

I like EZCONNECT because it is simple when we know the host:port, and I like External Password Files because I hate to see passwords in clear text. But the combination of the two was not easy before 19c.

Of course, you can add a wallet entry for an EZCONNECT connection string, like ‘//localhost/PDB1’ but in the wallet, you need a different connection string for each user because it associates a user and password to a service name. And you have multiple users connecting to a service.

Here is an example. I have a user DEMO with password MyDemoP455w0rd:

SQL*Plus: Release 19.0.0.0.0 - Production on Thu Apr 4 19:19:47 2019
Version 19.2.0.0.0
Copyright (c) 1982, 2018, Oracle.  All rights reserved.
SQL> connect sys/oracle@//localhost/PDB1 as sysdba
Connected.
SQL> grant create session to demo identified by MyDemoP455w0rd;
Grant succeeded.
SQL> exit
Disconnected from Oracle Database 19c Enterprise Edition Release 19.0.0.0.0 - Production
Version 19.2.0.0.0

I create a wallet:

mkdir -p /tmp/wallet
mkstore -wrl /tmp/wallet -create <<END
MyWall3tP455w0rd
MyWall3tP455w0rd
END

I add an entry for service name PDB1_DEMO connecting to PDB1 with user DEMO:

mkstore -wrl /tmp/wallet -createCredential PDB1_DEMO DEMO <<END
MyDemoP455w0rd
MyDemoP455w0rd
MyWall3tP455w0rd
END

I define sqlnet.ora to use it and tnsname.ora for this PDB1_DEMO entry:

echo "
WALLET_LOCATION=(SOURCE=(METHOD=FILE)(METHOD_DATA=(DIRECTORY=/tmp/wallet)))
SQLNET.WALLET_OVERRIDE=TRUE
" >> /tmp/wallet/sqlnet.ora
echo "
PDB1_DEMO=(DESCRIPTION=(CONNECT_DATA=(SERVICE_NAME=PDB1))(ADDRESS=(PROTOCOL=tcp)(HOST=localhost)(PORT=1521)))
" >> /tmp/wallet/tnsnames.ora

I can connect passwordless when running sqlplus with TNS_ADMIN=/tmp/wallet where I have the sqlnet.ora and tnsnames.ora:

SQL*Plus: Release 19.0.0.0.0 - Production on Thu Apr 4 19:19:49 2019
Version 19.2.0.0.0
Copyright (c) 1982, 2018, Oracle.  All rights reserved.
SQL> connect /@PDB1_DEMO
Connected.
SQL> show user
USER is "DEMO"
SQL> exit
Disconnected from Oracle Database 19c Enterprise Edition Release 19.0.0.0.0 - Production
Version 19.2.0.0.0

Eazy Connect

I add a new entry for the EZCONNECT string:

mkstore -wrl /tmp/wallet -createCredential //localhost/PDB1 DEMO <<END
MyDemoP455w0rd
MyDemoP455w0rd
MyWall3tP455w0rd
END

I can connect with it:

SQL*Plus: Release 19.0.0.0.0 - Production on Thu Apr 4 19:19:50 2019
Version 19.2.0.0.0
Copyright (c) 1982, 2018, Oracle.  All rights reserved.
SQL> connect /@//localhost/PDB1
Connected.
SQL> show user
USER is "DEMO"
SQL> exit
Disconnected from Oracle Database 19c Enterprise Edition Release 19.0.0.0.0 - Production

But what do you do when you need to connect with different users? With a tnsnames.ora you can have multiple entries for each one, like:

PDB1_DEMO,PDB1_SCOTT=(DESCRIPTION=(CONNECT_DATA=(SERVICE_NAME=PDB1))(ADDRESS=(PROTOCOL=tcp)(HOST=127.0.0.1)(PORT=1521)))

and then define a credential for each one. But that is not possible with EZCONNECT. Or you have to define a different server for each user — which may not be a bad idea by the way.

19c dummy parameter

Oracle 19c extends the EZCONNECT syntax as I described recently in:

19c Easy Connect

With this syntax, I can add parameters. And then, why not some dummy parameters to differentiate multiple entries connecting to the same database but with different users? Here is an example:

mkstore -wrl /tmp/wallet \
-createCredential //localhost/PDB1?MyUserTag=DEMO DEMO <<END
MyDemoP455w0rd
MyDemoP455w0rd
MyWall3tP455w0rd
END

This just adds a parameter that will be ignored, but helps me to differentiate multiple entries:

$ tnsping //localhost/PDB1?MyUserTag=DEMO
TNS Ping Utility for Linux: Version 19.0.0.0.0 - Production on 04-APR-2019 19:41:49
Copyright (c) 1997, 2018, Oracle.  All rights reserved.
Used parameter files:
Used HOSTNAME adapter to resolve the alias
Attempting to contact (DESCRIPTION=(CONNECT_DATA=(SERVICE_NAME=PDB1))(MyUserTag=DEMO)(ADDRESS=(PROTOCOL=tcp)(HOST=127.0.0.1)(PORT=1521)))
OK (0 msec)

Here is my connection to DEMO using the credentials in the wallet:

SQL*Plus: Release 19.0.0.0.0 - Production on Thu Apr 4 19:19:51 2019
Version 19.2.0.0.0
Copyright (c) 1982, 2018, Oracle.  All rights reserved.
SQL> connect /@//localhost/PDB1?MyUserTag=demo
Connected.
SQL> show user
USER is "DEMO"
SQL> exit
Disconnected from Oracle Database 19c Enterprise Edition Release 19.0.0.0.0 - Production
Version 19.2.0.0.0

I need an sqlnet.ora and a wallet, but no tnsnames.ora

Here are all the entries that I can use:

$ mkstore -wrl /tmp/wallet -listCredential
Oracle Secret Store Tool Release 19.0.0.0.0 - Production
Version 19.2.0.0.0
Copyright (c) 2004, 2018, Oracle and/or its affiliates. All rights reserved.
Enter wallet password:
List credential (index: connect_string username)
3: //localhost/PDB1?MyUserTag=demo DEMO
2: //localhost/PDB1 DEMO
1: PDB1_DEMO DEMO

I do not use it for applications. The host name is not a problem as I can have a DNS alias for each application, but I don’t want the listener port hardcoded there. Better a centralized tnsnames. ora or LDAP.

However, for the administration scripts like RMAN backups or duplicates, or Data Guard broker, a simple passwordless EZCONNECT is easier.

zHeap: PostgreSQL with UNDO

$
0
0

I’m running on an Oracle Cloud Linux 7.6 VM provisioned as a sandbox so I don’t care about where it installs. For a better installation procedure, just look at Daniel Westermann script in:

Some more zheap testing - Blog dbi services

The zHeap storage engine (in development) is provided by EnterpriseDB:

EnterpriseDB/zheap

I’ll also use pg_active_session_history, the ASH (Active Session History) approach for PostgreSQL, thanks to Bertrand Drouvot

pgsentinel/pgsentinel

In order to finish with the references, I’m running this on an Oracle Cloud compute instance (but you can run it anywhere).

Cloud Computing VM Instances - Oracle Cloud Infrastructure

Here is what I did on my OEL7 VM to get PostgreSQL with zHeap:

# Install and compile

sudo yum install -y git gcc readline-devel zlib-devel bison-devel
sudo mkdir -p /usr/local/pgsql
sudo chown $(whoami) /usr/local/pgsql
git clone https://github.com/EnterpriseDB/zheap
cd zheap && ./configure && make all && make install
cd contrib && make install
cd ../..

# Create a database

# Environment

export PGDATA=/var/lib/pgsql/data
echo "$PATH" | grep /usr/local/pgsql/bin ||
export PATH="$PATH:/usr/local/pgsql/bin"

# Creation of the database and start the server

initdb
pg_ctl start
ps -edf | grep postgres && psql postgres <<<"\l\conninfo\;show server_version;"

# Install pg_Sentinel extension

git clone https://github.com/pgsentinel/pgsentinel.git
cd pgsentinel/src && make && make install
cat >> $PGDATA/postgresql.conf <<CAT
shared_preload_libraries = 'pg_stat_statements,pgsentinel'
track_activity_query_size = 2048
pg_stat_statements.track = all
CAT
psql postgres -c "create extension pgsentinel;"

# create a demo database

psql postgres -c "create database demo;"
psql demo -c "create extension pgsentinel;"

Undo and discard workers

Here I am. Don’t worry about the user running it, that’s just me using what I already have there, but you can create a postgres user. I’m in a version 12 in development:

ps -edf | grep postgres && psql postgres <<<"\l\conninfo\;show server_version;show config_file;"
ps -edf | grep postgres && psql postgres <<<”\l\conninfo\;show server_version;show config_file;”

zHeap vs. Heap

In the past I measured the redo journaling (WAL) by PostgreSQL (https://blog.dbi-services.com/full-page-logging-in-postgres-and-oracle/) because, coming from Oracle, I was surprised by the amount of redo generated by some small updates in PostgreSQL. This overhead is due to the combination of two weaknesses: full page logging and no in-place update. The second will be partially addressed by zHeap, so let’s do the same test.

strace | awk

Here is the awk script I use to measure the volume written to disk

strace -fye trace=write,pwrite64 -s 0 pg_ctl start 2>&1 >/dev/null | awk '
/^.pid *[0-9]+. /{
pid=$2 ; sub("]","",pid)
"cat /proc/" pid "/cmdline" |& getline cmdline
sub(/pid *[0-9]+/,sprintf("%-80s ",cmdline))
}
/pg_wal/ || /undo/ {
sub(/[0-9A-Z]+>/,"...>")
}
/pwrite64[(].*, *[0-9]+, *[0-9]+[)]/{
sub(/, *[0-9]+[)].*/,"")
bytes=$NF
$NF=""
$0=$0",...)..."
sub(/[(][0-9]+</,"(...<")
sum[$0]=sum[$0]+bytes
cnt[$0]=cnt[$0]+1
next
}
/write[(].*, *[0-9]+[)]/{
sub(/[)].*/,"")
bytes=$NF
$NF=""
$0=$0")..."
sub(/[(][0-9]+</,"(...<")
sum[$0]=sum[$0]+bytes
cnt[$0]=cnt[$0]+1
next
}
/^[^0-9]/{next}
{ print > "/dev/stderr" }
END{
printf "%9s%1s %6s %7s %s\n","BYTES","","COUNT","AVG","process/file"
for (i in sum){
s=sum[i]
u=" "
if(s>10*1024){s=s/1024;u="K"}
if(s>10*1024){s=s/1024;u="M"}
if(s>10*1024){s=s/1024;u="G"}
if (cnt[i]>1) printf "%9d%1s %6d %7d %s\n",s,u,cnt[i],sum[i]/cnt[i],i
}
}
' | sort -h

I strace the write calls (-e trace=write, pwrite64) without showing the data written (-s 0) when running the database server (pg_ctl start), tracing all child processes (-f) and showing the file names with the descriptor (-y). The awk keeps only the call, file, pid and bytes written to aggregate them. The pid is expanded with the process argv[0] for better readability.

Create zHeap table

Here is the table as in the previous blog post, but mentioning zHeap storage:

create table demoz using zheap as select generate_series a,generate_series b,generate_series c,generate_series d,generate_series e,generate_series f,lpad('x',100,'x') g from generate_series(0,0);
insert into demoz select generate_series a,generate_series b,generate_series c,generate_series d,generate_series e,generate_series f,lpad('x',100,'x') g from generate_series(1,1000000);

Sparse update on one column

Here is the update that I wanted to test:

update demoz set b=b+1 where mod(a,10)=1;
UPDATE 100000

And the result of my strace|awk script on these 100000 updates:

- 4403+2047=1645 8k blocks, which is 112+15=127MB of data
- 120+14=134MB of WAL
- 15+14+2=31MB of UNDO
The volume of undo is approximately the real volume of changes (I had 15MB of redo and 6MB of undo with same update on Oracle). But we still have an exaggerated volume of block changes (and with full-page logging).

I’ve created the same table in default Heap storage, and here is the write() trace for the same update:

- 16191+4559+1897=22647 8k blocks, which is 175MB of data
- 131+33=164MB of WAL

On this use case, which is quite common when we process data (call record, orders, …) and set only a flag or a date to mark them as processed, it seems that zHeap helps, but not a lot. But a real case would have many indexes on this table and updating in-place may reduce the overhead for non-updated columns. That’s for a future post.

19c EM Express (aka Oracle Cloud Database Express)

$
0
0

Oracle has a long history of interactive tools for DBA and, as usual, the name has changed at each evolution for marketing reasons.

OEM in Oracle7 #nostalgia

SQL*DBA had a Menu mode for text terminals. You may also remember DBA Studio. Then called Oracle Enterprise Manager with its SYSMAN repository and also referred to as OEM or EM. The per-database version has been called OEM “Database Control” and then “EM Express” in 12c. The multi-database version has been called according to the marketing tag “Grid Control” in 11g, and “Cloud Control” in 12c.

I hate those names because they are wrong. A central console has nothing to do with “grid” or “cloud” and the only all-targets view is the ‘DB Load Map’ page. Something is wrong when a customer talks about “The Grid” and you don’t know if it is about the administration console (OEM) or the clusterware Grid Infrastructure (GI). Even worse with a one-database only GUI.

19c EM Express login screen when connecting to CDB port

But marketing always win. And in 19c this small single-database graphical interface, mostly used by small companies having few databases hosted in their premises, is called “Oracle Cloud Database Express”.

Remember that you need to define the port where EM Express runs. It runs with XDB, and the syntax to set is not easy to remember: underscores for package name, but no underscores for the http/https function name):

SQL> exec dbms_xdb_config.sethttpsport(5500);
PL/SQL procedure successfully completed.

SYSDBA

As you can see in the login screenshot, there’s no way to mention that I want to connect ‘as sysdba’ so let’s try with different users to see if the role is chosen autonomously:

grant create session,sysdba to c##sysdba identified by "oracle" container=all;
grant create session,sysoper to c##sysoper identified by "oracle" container=all;
grant dba to c##dba identified by "oracle" container=all;
grant sysdba,sysoper,dba to c##all identified by "oracle" container=all;

Actually, I was able to connect with SYS but not with my own SYSDBA users. Here are the only successful connections:

C##DBA (role DBA) and SYS can connect, but not my SYSDBA custom users

It is probably not a big problem for the moment, given the very limited features that are there. No need for SYSDBA to read performance statistics and kill sessions. I’ll update this post when I have more information about this.

Container

As you can see in the login screenshot, I can mention a container name, the default being the CDB root. However, when I try to do so I get the XDB login popup (same as when I forgot the /em in the URL) and ‘Invalid Container’.

The workaround is to open a port for each PDB and connect directly to it.

Features

You remember how the move from the 11g dbconsole to 12c EM Express removed many items in the menus. Here is the 19c database express one:

There’s only one item in the 19.2 menu: Performance/ Performance Hub

One item only in a menu… my guess (and hope) is that this one is still work-on-progress. 19c is currently for Exadata only and Ican imagine that all installations are managed by Oracle Enterprise Manager. Or maybe SQL Developer Web will become the replacement for this console.

HTML5, ASH Analytics,…

There’s one awesome news here: end of Flash. This Performance Hub is nice and responsive. No Adobe Flex anymore, but the same idea with an HTML that contains the data (XML) and calls an online script to display it: https://download.oracle.com/otn_software/omx/emsaasui/emcdbms-dbcsperf/active-report/scripts/activeReportInit.js

SQL Monitor shows the predicates on the same tab as execution statistics:

There’s a tab to go directly to the execution plan operation which is the busier:

EM Express (I’ll continue to call it like this) can be used on Data Guard as well and can monitor the recovery on the read-only CDB$ROOT:

I can kill a session but not (yet?) cancel a running SQL statement:

The activity tab is similar to the ASH Analytics where I can choose the dimensions displayed:

and I can also remove the time dimension to show three other dimensions:

You should set OCSID.CLIENTID

$
0
0

each time you grab an Oracle JDBC connection from the pool

For troubleshooting and monitoring performance, you want to follow what happens from the end-user to the database. It is then mandatory to identify the end-user and application from the database session. With Oracle there are some ‘dbms_application_info’ strings to be set, like MODULE, ACTION and CLIENT_INFO. That’s about the tasks in the application code (like identifying the Java class or method from which the SQL statement is prepared) but that’s not about the end-user.

And you should forget about the CLIENT_INFO which is not very useful and rather misleading. OCSID.MODULE and OCSID.ACTION are set from JDBC with Connection.setClientInfo (One reason I find the CLIENT_INFO name misleading is that it cannot be set with setClientInfo). Of course, you can also call ‘dbms_application_info.set_module’ but that’s an additional call to the database (which means network latency, OS context switch,…). Using the JDBC setClientInfo with the OCSID namespace sends this information with the next call.

Now, about identifying the end-user, there’s the session CLIENT_ID (aka CLIENT_IDENTIFIER) that you can also set with Connection.setClientInfo (OCSID.CLIENTID). This one is visible in many Oracle views and follows the database links. Here is an example, I create a demo user and a database link:

connect sys/oracle@//localhost/PDB1 as sysdba
drop public database link PDB1@SYSTEM;
grant dba to demo identified by demo;
create public database link PDB1@SYSTEM connect to SYSTEM
identified by oracle using '//localhost/PDB1';

The following JavaScript (run from SQLcl) connects with a JDBC Thin driver, sets OCSID.MODULE, OCSID.ACTION and OCSID.CLIENTID, and displays CLIENT_IDENTIFIER, MODULE and ACTION from V$SESSION:

script
var DriverManager = Java.type("java.sql.DriverManager");
var con = DriverManager.getConnection(
"jdbc:oracle:thin:@//localhost/PDB1","demo","demo"
);
con.setAutoCommit(false);
function showSessionInfo(){
var sql=con.createStatement();
var res=sql.executeQuery("\
select client_identifier,service_name,module,action,value \
from v$session \
join v$mystat using(sid) \
join v$statname using(statistic#) \
where name='user calls' \
");
while(res.next()){
print();
print(" CLIENT_IDENTIFIER: "+res.getString(1));
print(" SERVICE: "+res.getString(2));
print(" MODULE: "+res.getString(3));
print(" ACTION: "+res.getString(4));
print(" User Calls: "+res.getInt(5));
print();
}
}
showSessionInfo();
con.setClientInfo('OCSID.CLIENTID','my Client ID');
con.setClientInfo('OCSID.MODULE','my Module');
con.setClientInfo('OCSID.ACTION','my Action');
showSessionInfo();
// run a statement through DBLINK:
var sql=con.createStatement();
sql.executeUpdate("call dbms_output.put_line@PDB1@SYSTEM(null)");

I also display the ‘user calls’ from V$MYSTAT. Here is the output:

SQL> .
CLIENT_IDENTIFIER: null
SERVICE: pdb1
MODULE: JDBC Thin Client
ACTION: null
User Calls: 4
CLIENT_IDENTIFIER: my Client ID
SERVICE: pdb1
MODULE: my Module
ACTION: my Action
User Calls: 5

The second execution sees the MODULE, ACTION and CLIENT_IDENTIFIER set with the previous setClientInfo(). And the most important is that the ‘user calls’ statistic has been incremented only by one, which means that setting them did not add any additional roundtrips to the database server.

Now, after the call through database link, I display all user sessions from V$SESSION. I can see my SQLcl (java) with nothing set, the JDBC thin session with MODULE, ACTION and CLIENT_IDENTIFIER, and the DBLINK session (connected to SYSTEM) with only the CLIENT_IDENTIFIER set:

SQL> select username,client_identifier,module,action
2 from v$session where type='USER';
  USERNAME   CLIENT_IDENTIFIER                   MODULE       ACTION
__________ ___________________ ________________________ ____________
SYSTEM my Client ID oracle@db192
SYS java@db192 (TNS V1-V3)
DEMO my Client ID my Module my Action

Following the end-user down to all layers (application, database, remote databases) is great for end-to-end troubleshooting and performance analysis. Set this OCSID.CLIENTID to identify the application (micro-)service and the end-user (like a browser Session ID), for no additional cost, and you will find this information in many performance views:

select table_name, listagg(distinct column_name,', ') 
within group (order by column_name)
from dba_tab_columns
where column_name in ('CLIENT_IDENTIFIER','CLIENT_INFO','CLIENT_ID','MODULE','ACTION')
--and table_name like 'GV%'
group by table_name
order by 2;

You see how the ‘CLIENT_INFO’ is useless (except for an additional level to module/action for SQL Monitor) and how CLIENT_ID(ENTIFIER) is everywhere, including ASH (Active Session history).

With a micro-services architecture, you will have many connections to the database (don’t tell me that each microservice has its own database — databases were invented decades ago when streaming data everywhere was an un-maintainable/un-scalable/errorprone mess, and schemas and views were invented to provide this data-micro-services within the same database system). Then the best practice is to:

  • connect with a dedicated SERVICE_NAME
  • identify the end-user with a CLIENT_ID

and then end-to-end tracing, tuning and troubleshooting will become easy.

Thanks for your feedback Rafael.

$
0
0

Thanks for your feedback Rafael. I think this is 12c drivers but works on lower database versions, excepts some bugs. So better test it…

Avoid compound hints for better Hint Reporting in 19c

$
0
0

Even if the syntax accepts it, it is not a good idea to write a hint like:

https://docs.oracle.com/en/database/oracle/oracle-database/19/sqlrf/Comments.html#GUID-56DAA0EC-54BB-4E9D-9049-BCEA934F7A89

/*+ USE_NL(A B) */ with multiple aliases (‘tablespec’) even if it is documented.

One reason is that it is misleading. How many people think that this tells the optimizer to use a Nested Loop between A and B? That’s wrong. This hint just declares that Nested Loop should be used if possible when joining from any table to A, and for joining from any table to B.

Actually, this is a syntax shortcut for: /*+ USE_NL(A) USE_NL(B) */

The other reason is that the 19c Hint Reporting will not tell you wich join was possible or not. Here is an example:

SQL> create table demo0 as select 1 x from dual;
Table DEMO0 created.
SQL> create table demo1 as select 1 id from dual;
Table DEMO1 created.
SQL> create table demo2 as select 1 id from dual;
Table DEMO2 created.
SQL> explain plan for
select /*+ USE_HASH(demo1 demo2) */ *
from demo1 join demo2 using(id);
Explained.
SQL> select * from dbms_xplan.display(format=>'basic +rows +hint_report');
PLAN_TABLE_OUTPUT                                                   
--------------------------------------------------------------------
Plan hash value: 3212315601

--------------------------------------------
| Id | Operation | Name | Rows |
--------------------------------------------
| 0 | SELECT STATEMENT | | 1 |
| 1 | HASH JOIN | | 1 |
| 2 | TABLE ACCESS FULL| DEMO1 | 1 |
| 3 | TABLE ACCESS FULL| DEMO2 | 1 |
--------------------------------------------

Hint Report (identified by operation id / Query Block Name / Object
Alias):
Total hints for statement: 2 (U - Unused (1))
--------------------------------------------------------------------
2 -  SEL$58A6D7F6 / DEMO1@SEL$1
U - USE_HASH(demo1 demo2)

3 - SEL$58A6D7F6 / DEMO2@SEL$1
- USE_HASH(demo1 demo2)

Here, my hint was used to join to DEMO2 but not to join to DEMO1 because the optimizer didn’t choose a plan with DEMO1 as the inner table. This is reported by the 19c dbms_xplan: I have two lines, one for the used hint and one for the Unused one. But both mention the same hint because I used a compound syntax.

I have more detail in the PLAN_TABLE.OTHER_XML, with the state ‘NU’ but still mentioning the full hint with the two alias names:

SQL> select cast(extract(xmltype(other_xml),'//hint_usage/q/t/h') as varchar2(4000)) from plan_table where other_xml like '%hint_usage%';
CAST(EXTRACT(XMLTYPE(OTHER_XML),'//HINT_USAGE/Q/T/H')ASVARCHAR2(4000
--------------------------------------------------------------------
<h o="EM"><x><![CDATA[USE_HASH(demo1 demo2)]]></x></h>
<h o="EM" st="NU"><x><![CDATA[USE_HASH(demo1 demo2)]]></x></h>

Now, running the same query with the two USE_HASH hints, one for each alias:

SQL> explain plan for
select /*+ USE_HASH(demo1) USE_HASH(demo2) */ *
from demo1 join demo2 using(id);
Explained.
SQL> select * from dbms_xplan.display(format=>'basic +rows +hint_report');
PLAN_TABLE_OUTPUT
--------------------------------------------------------------------
Plan hash value: 3212315601

--------------------------------------------
| Id | Operation | Name | Rows |
--------------------------------------------
| 0 | SELECT STATEMENT | | 1 |
| 1 | HASH JOIN | | 1 |
| 2 | TABLE ACCESS FULL| DEMO1 | 1 |
| 3 | TABLE ACCESS FULL| DEMO2 | 1 |
--------------------------------------------

Hint Report (identified by operation id / Query Block Name / Object Alias):
Total hints for statement: 2 (U - Unused (1))
--------------------------------------------------------------------

2 - SEL$58A6D7F6 / DEMO1@SEL$1
U - USE_HASH(demo1)

3 - SEL$58A6D7F6 / DEMO2@SEL$1
- USE_HASH(demo2)

Everything is clear now: the hint on DEMO1 was not used but the hint on DEMO2 was used.

SQL> select cast(extract(xmltype(other_xml),'//hint_usage/q/t/h') as varchar2(4000)) from plan_table where other_xml like '%hint_usage%';
CAST(EXTRACT(XMLTYPE(OTHER_XML),'//HINT_USAGE/Q/T/H')ASVARCHAR2(4000))
--------------------------------------------------------------------
<h o="EM"><x><![CDATA[USE_HASH(demo2)]]></x></h>
<h o="EM" st="NU"><x><![CDATA[USE_HASH(demo1)]]></x></h>

Having the detail for each join hinted is also useful to get the reason. For example, if I hint with an inexistent alias, like /*+ USE_HASH(demo1) USE_HASH(demoX) */, I have two different reasons — ‘Unused’ and ‘uNresolved’:

Total hints for statement: 2 (U - Unused (1), N - Unresolved (1))
--------------------------------------------------------------------

1 - SEL$58A6D7F6
N - USE_HASH(demoX)

2 - SEL$58A6D7F6 / DEMO1@SEL$1
U - USE_HASH(demo1)

With one compound hint, I will not know which ’N’ and which is ‘U’

I’ll show this with the two internal states of ‘Unused’ by adding an additional cartesian join with DEMO0:

SQL> explain plan for
select /*+ USE_HASH(demo0) USE_HASH(demo1) USE_HASH(demo2) */ *
from demo0 cross join demo1 join demo2 using(id);
Explained.
SQL> select * from dbms_xplan.display(format=>'basic +rows +hint_report');
PLAN_TABLE_OUTPUT 
--------------------------------------------------------------------
Plan hash value: 61862555

-----------------------------------------------
| Id | Operation | Name | Rows |
-----------------------------------------------
| 0 | SELECT STATEMENT | | 1 |
| 1 | HASH JOIN | | 1 |
| 2 | MERGE JOIN CARTESIAN| | 1 |
| 3 | TABLE ACCESS FULL | DEMO0 | 1 |
| 4 | BUFFER SORT | | 1 |
| 5 | TABLE ACCESS FULL | DEMO1 | 1 |
| 6 | TABLE ACCESS FULL | DEMO2 | 1 |
-----------------------------------------------

Hint Report (identified by operation id / Query Block Name / Object Alias):
Total hints for statement: 2 (U - Unused (1))
--------------------------------------------------------------------

3 - SEL$9E43CB6E / DEMO0@SEL$1
U - USE_HASH(demo0)

5 - SEL$9E43CB6E / DEMO1@SEL$1
U - USE_HASH(demo1)

6 - SEL$9E43CB6E / DEMO2@SEL$2
- USE_HASH(demo2)
SQL> select cast(extract(xmltype(other_xml),'//hint_usage/q/t/h') as varchar2(4000)) from plan_table where other_xml like '%hint_usage%';
CAST(EXTRACT(XMLTYPE(OTHER_XML),'//HINT_USAGE/Q/T/H')ASVARCHAR2(4000))
--------------------------------------------------------------------
<h o="EM"><x><![CDATA[USE_HASH(demo2)]]></x></h>
<h o="EM" st="EU"><x><![CDATA[USE_HASH(demo1)]]></x></h>
<h o="EM" st="NU"><x><![CDATA[USE_HASH(demo0)]]></x></h>

The USE_HASH(demo0) is impossible because, as above, it is the first outer table. It has the internal unused state of ‘NU’. The USE_HASH(demo1) is a possible join but not used because the join type (cartesian) is incompatible with the hash join. The unusable state for it is ‘EU’. If you have any guess about those names (‘NU’/’EU’), or any comment, don’t forget my Twitter:

Franck Pachot (@FranckPachot) | Twitter


PostgreSQL and Jupyter notebook

$
0
0

Here is a little test of Jupyter Notebook to access a PostgreSQL database with very simple installation, thanks to Anaconda. I did it on Windows 10 but the same simplicity is on Linux and Mac.

Anaconda

I’ll use Anaconda to install the required components

Conda is an open source package management system and environment management system that runs on Windows, macOS and Linux. Conda quickly installs, runs and updates packages and their dependencies.
https://www.anaconda.com/distribution/#download-section

Installation

The install is very easy — just go to https://www.anaconda.com/ and download for your environment. Then, manage everything from the Anaconda Navigator. I choose the Python3 64-bit version for Windows.

I used all defaults, the installation directory being in the %USERPROFILE% home directory (like C:\Users\Franck\Anaconda3).

This installs a few shortcuts in the Start Menu, such as the Anaconda Prompt (the command line where you can run conda, with all environment set) in CMD and PowerShell version, or the Jupyter notebook.

You can run everything from the Anaconda Navigator, for example, get the command line with all the environment set:

Or you can simply run the Anaconda Prompt in the Start Menu which is a shortcut for:

%windir%\System32\cmd.exe "/K" C:\Users\Franck\Anaconda3\Scripts\activate.bat C:\Users\Franck\Anaconda3

Now, from this prompt, I’ll install a few additional packages

IPython SQL

ipython-sql introduces a %sql (or %%sql) magic to your notebook allowing you to connect to a database, using SQLAlchemy connect strings, then issue SQL commands within IPython or IPython Notebook.

catherinedevlin/ipython-sql

Here is how to install it from the Anaconda Prompt:

conda install -y -c conda-forge ipython-sql

PostgreSQL

I’ll run the postgres server directly in this environment:

conda install -y -c conda-forge postgresql

The link between ipython-sql and the postgresql API is done by psycopg2:

Psycopg is the most popular PostgreSQL adapter for the Python programming language. Its main features are the complete implementation of the Python DB API 2.0 specification and the thread safety.
conda install -y -c anaconda psycopg2

I also install Pgspecial to run the ‘backslash’ commands like in psql

conda install -y -c conda-forge pgspecial

Create a database

From the Anaconda Prompt, I create my PostgreSQL database in C:\Anaconda\pgdata:

set PGDATA=C:\Anaconda\pgdata
mkdir %PGDATA%
pg_ctl initdb
pg_ctl start
psql -c "create database DEMO;" postgres

I’m now ready to run some SQL from the Jupyter notebook and do not need the Anaconda Prompt anymore (I can run shell commands from a notebook).

Jupyter Notebook

I can start Jupyter from the Anaconda Navigator, but it defaults to the %USERPROFILE% directory.

I prefer to change the Jupyter Notebook shortcut (right-click-more-open file location-properties) to replace USERPROFILE with my C:\Anaconda directory which will be where I’ll create notebooks:

C:\Users\Franck\Anaconda3\python.exe C:\Users\Franck\Anaconda3\cwp.py C:\Users\Franck\Anaconda3 C:\Users\Franck\Anaconda3\python.exe C:\Users\Franck\Anaconda3\Scripts\jupyter-notebook-script.py "C:\Anaconda/"

Or simply run it from the Anaconda Prompt:

jupyter.exe notebook --notebook-dir=C:\Anaconda

This runs Jupyter and opens it in my browser. I create a new notebook with New-Python3:

I load the iPython SQL extension:

%load_ext sql

connect to the DEMO database

%sql postgresql://localhost/demo

and I can run some SQL statements, like:

%sql select version()

But I’ll not put more commands in this blog post, because that’s the main advantage of a Jupyter Notebook: show the commands, the output, and some comments.

GitHub Gist and Medium

I’ve uploaded my notebook on GitHub Gist for easy sharing: Blog20190428-postgresql-and-jupyter-notebook-on-windows.ipynb

GitHub display it correctly, and you can download it to test on your environment. And Medium seems to embed it in a very way:

🤔 Now thinking about it, most of my blog posts contain some code, some output, and titles and comments around them… And I try to build the examples with scripts that can be re-run easily. That’s exactly the goal of the notebook, without the risk of copy/paste error and easy to re-run on a newer version. I’ll try this idea but don’t worry, I’ll link from Medium so continue to follow here and comment on Twitter.

Hi Piotr, Bug 29534218 : WITH THE NEW MULTIHOST EZCONNECT METHOD GET WRONG OUTPUTS is in status 16…

$
0
0

Hi Piotr, Bug 29534218 : WITH THE NEW MULTIHOST EZCONNECT METHOD GET WRONG OUTPUTS is in status 16 — Bug Screening/Triage

#VDC19 Voxxed Days CERN 2019

$
0
0

This was the first time I attended to Voxxed Days. I was also speaker there for a short live-demo talk during lunch. And that was an awesome experience and the occasion to meet people I don’t see in Oracle User Groups conferences. Organized at CERN, the speakers were able to visit the CMS experiment (A 14,000 tonnes 100 meters underground detector, observing the result of the collision of protons accelerated in the LHC), and that probably helps to motivate the best speakers to come. And kudos to the colleagues at the organization of this event.

The event was sponsored by Oracle Groundbreakers. Oracle Switzerland offered some Cloud trials where you don’t have to put your credit card number and that’s a really good initiative, finally.

And look at the end of this post the video made by Romy Lienhard during the CMS visit and the conference.

Keynote: Robert C. Martin, aka Uncle Bob

I really enjoyed hearing Uncle Bob message. I put quotes in bold here. Today, many organizations push to faster releases, more and more feature, and unachievable deadlines. But that, unfortunately, lowers the quality of software delivered.

If we value only the lines of code, the frequency of releases, and the number of features, this apparent productivity is:
unstable productivity
and will fail one day. But who will be responsible for this failure? As a software engineer, you must not ship shit. You may think that you were forced by your manager’s unreasonable deadlines. But remember that you were hired because you know and they don’t. You must be professional and say no. Frequent releases are good only when they ensure that you ship only what works and will be stable. IT professionalism must ban the ship of code that will fail and be unmaintainable.

With my DBA eyes, I see many applications that fail to scale with more users, more data, or that break when a database upgrade reveals a bug that was hiding there. This can be solved only at the root: the quality of the design and code. Do not rely on the UAT to find those design weaknesses. Who tests concurrent updates during UAT? Who tests with the future volume of data? Who tests with the future database versions?

The Error of our Ways

A nice continuation was Kevlin Henney’s session. He is famous showing when the magic shell of software applications is failing, displaying the naked error stack, blue screen, like:

That’s part of our software maker professionalism: not only ship new features specified by the business, but also be sure to handle all the unexpected exceptions. When errors break the magic of the GUI, you will give a very bad impression of your company, and you open many security weaknesses.

In the database area, this means that if you are subject to SQL injection (because not using queries parameters with bind variables), and in addition to that you expose the database and the name of tables, then you are giving two axes to break into your system.

Have fun!

Yes, productivity can be increased by having fun. Holly Cummins from IBM explains the importance of having fun in the workplace and how to get it.

In the database area, this is probably the main reason to go to DevOps: stop that fight between Developer and DBA and be happy to work together.

Follow the link for the blog post and slides, my best part is about DevOps and Automation: Repetition is boring. Automating stuff is fun.

Deep learning in computer vision

The best demo I’ve seen so far was from Krzysztof Kudryński (Nvidia) and Błażej Kubiak (TomTom). First, showing the coding iterations to solve an image recognition pattern, like a human face wearing glasses or not.

And then face recognition, in live demo, with a mobile phone and a laptop: record one face and then be able to recognize the same person within a group of people. Beyond the computer thing, it was also a nice exposure on the demo effect, and the human factor about it. Demos fail in a talk because the conditions are different. I love this fail because of the scientific approach of the speakers to fix it. It didn’t work to record the face of an attendee in the audience. It worked when the speaker did it on himself. Then empirically find what’s different: the glasses, the light,… and finally, the fact that there were many faces in the background. Those things that you know perfectly and forget once you are face to the audience, thinking about your talk, the time, and everything…

The speakers never gave up and finally had a great working demo.

Compact Muon Solenoid, Council Chamber and Main Auditorium

Want to have a look at the venue — between Council Chamber and Main Auditorium? Here’s the video made by Romy Lienhard:

see you next year?

Easy Oracle Cloud wallet location in the JDBC connection string

$
0
0

I wrote about the 19c easy-connect string recently and the possibility to use a wallet with it (and no need for a tnsnames.ora then):

19c EZCONNECT and Wallet (Easy Connect and External Password File)

That was with sqlplus and setting TNS_ADMIN and still requires sqlnet.ora to set the wallet location directory. This post adds two things:

  • TNS_NAMES parameter in the JDBC URL with no need for
    the java -Doracle.net.tns_admin
  • We can add our password to the cloud wallet downloaded from the Autonomous Database (ATP/ADW)

Oracle Cloud user

For this test I’ve created a new user in my Autonomous Transaction Processing cloud service.

The click-path is:

  • Autonomous Database
  • Autonomous Database Details
  • Service Console
  • Administration
  • Manage ML Users (yes, this is the Machine Learning interface)
  • Create User

I’ve created the user Franck with password T1s1s@UserPassword (with an at-sign on purpose to show you that it is annoying but manageable).

A side note here because this is the most hidden part of these autonomous services. You are in the Machine Learning interface and if you click on the Home button on top right you can log with this user and access a Jupyter Notebook to run some SQL statements.

I’m opening one ‘SQL Script Scratchpad’ here to see my roles. Actually, a user created from this Oracle ML interface is a developer user with the role ‘OML_DEVELOPER’ and the role ‘DWROLE’ (even it this is ATP and not ADW). This differs from the ADMIN user which has many more roles.

You can create the same user from the sql command line or SQL Developer connected as ADMIN. But, for this, we need to the credentials wallet first.

Oracle Cloud wallet

I will connect with this user from my on-premises (aka laptop;) and then I need to download the credential wallet which contains everything I need to connect to the service remotely.

The web path is:

  • Autonomous Database
  • Autonomous Database Details
  • Service Console
  • Download Client Credentials (Wallet)

I enter a password for this wallet: T1s1s@WalletPassword and get a .zip file. This is not a password-protected ZIP. The password is the wallet password. Note that this is common to all my compartment database services and I’ll see all of them in the tnsnames.ora. There’s one wallet per compartment. Finer security is done by each database with user authentication. But the wallet has the name of the service you downloaded from

Oracle JDBC client

I unzip the wallet:

[oracle@db193]$ unzip -d /home/oracle/mywallet /tmp/wallet_MYATP.zip
Archive: /tmp/wallet_MYATP.zip
inflating: /home/oracle/mywallet/cwallet.sso
inflating: /home/oracle/mywallet/tnsnames.ora
inflating: /home/oracle/mywallet/truststore.jks
inflating: /home/oracle/mywallet/ojdbc.properties
inflating: /home/oracle/mywallet/sqlnet.ora
inflating: /home/oracle/mywallet/ewallet.p12
inflating: /home/oracle/mywallet/keystore.jks

It contains 3 entries for each of my database services, with low/medium/high alternatives for resource management.

Here I’m using myatp_low:

[oracle@db193]$ grep myatp /home/oracle/mywallet/tnsnames.ora
myatp_low = (description= (address=(protocol=tcps)(port=1522)(host=adb.eu-frankfurt-1.oraclecloud.com))(connect_data=(service_name=vavxrlxx2llql7m_myatp_low.atp.oraclecloud.com))(security=(ssl_server_cert_dn="CN=adwc.eucom-central-1.oraclecloud.com,OU=Oracle BMCS FRANKFURT,O=Oracle Corporation,L=Redwood City,ST=California,C=US")) )

If I specify only the TNS_ADMIN, the tnsnames.ora is found but not the wallet (because the directory in sqlnet.ora is not setup with the wallet location):

[oracle@db193]$ TNS_ADMIN=/home/oracle/mywallet tnsping myatp_low
TNS Ping Utility for Linux: Version 19.0.0.0.0 - Production on 08-MAY-2019 20:21:20
Copyright (c) 1997, 2019, Oracle.  All rights reserved.
Used parameter files:
/home/oracle/mywallet/sqlnet.ora
Used TNSNAMES adapter to resolve the alias
Attempting to contact (description= (address=(protocol=tcps)(port=1522)(host=adb.eu-frankfurt-1.oraclecloud.com))(connect_data=(service_name=vavxrlxx2llql7m_myatp_low.atp.oraclecloud.com))(security=(ssl_server_cert_dn= CN=adwc.eucom-central-1.oraclecloud.com,OU=Oracle BMCS FRANKFURT,O=Oracle Corporation,L=Redwood City,ST=California,C=US)))
TNS-12560: TNS:protocol adapter error

jdbc:oracle:thin:…?TNS_ADMIN=…

I don’t care about sqlnet.ora here and I’ll use SQLcl with the thin JDBC connection. And since 18.3 the driver supports a TNS_ADMIN parameter in the URL to mention the TNS_ADMIN. And this one is used to find the tnsnames.ora but also the credential files:

[oracle@db193]$ sql Franck/'"T1s1s@UserPassword"'@myatp_low?TNS_ADMIN=/home/oracle/mywallet
SQLcl: Release 19.1 Production on Wed May 08 20:23:38 2019
Copyright (c) 1982, 2019, Oracle.  All rights reserved.
Connected to:
Oracle Database 18c Enterprise Edition Release 18.0.0.0.0 - Production
Version 18.4.0.0.0
SQL> show user
USER is "FRANCK"
SQL> show jdbc-- Database Info --
Database Product Name: Oracle
Database Product Version: Oracle Database 18c Enterprise Edition Release 18.0.0.0.0 - Production
Version 18.4.0.0.0
Database Major Version: 18
Database Minor Version: 0
-- Driver Info --
Driver Name: Oracle JDBC driver
Driver Version: 19.3.0.0.0
Driver Major Version: 19
Driver Minor Version: 3
Driver URL: jdbc:oracle:thin:@myatp_low
Driver Location:
resource: oracle/jdbc/OracleDriver.class
jar: /u01/app/oracle/product/DB193/jdbc/lib/ojdbc8.jar
JarSize: 4210517
JarDate: Fri Apr 05 03:38:42 GMT 2019
resourceSize: 2604
resourceDate: Thu Apr 04 20:38:40 GMT 2019

This is awesome because in previous JDBC driver versions you had to set this by adding a parameter in Java, like -Doracle.net.tns_admin or OracleConnection.CONNECTION_PROPERTY_TNS_ADMIN (or SET CLOUDCONFIG in SQLcl).

The 18.3 version of the driver is available for JDK 8 (ojdbc8.jar) and JDK 10 (ojdbc10.jar):

JDBC and UCP Downloads page

Passwordless connection

And there is more. You have an easy way to set the wallet location. You have a wallet. It is used to store the SSL/TLS certificate and key.

But you can use the same to store your passwords:

[oracle@db193]$ mkstore -wrl . -createCredential myatp_low Franck
Oracle Secret Store Tool Release 19.0.0.0.0 - Production
Version 19.3.0.0.0
Copyright (c) 2004, 2019, Oracle and/or its affiliates. All rights reserved.
Your secret/Password is missing in the command line
Enter your secret/Password: T1s1s@UserPassword
Re-enter your secret/Password: T1s1s@UserPassword
Enter wallet password:

Important note: this is easy for passwordless connection, but then the protection of those files are critical. Before, you needed the wallet and the user password to connect to your service. The wallet to reach the database, and the user password to connect to it. Now, anybody that has read access to the wallet can connect to your service with the stored credentials.

Here is the list of credentials stored there:

[oracle@db193]$ mkstore -wrl . -listCredential
Oracle Secret Store Tool Release 19.0.0.0.0 - Production
Version 19.3.0.0.0
Copyright (c) 2004, 2019, Oracle and/or its affiliates. All rights reserved.
Enter wallet password: T1s1s@WalletPassword
List credential (index: connect_string username)
1: myatp_low Franck

And even the stored password is easily visible when you provide the wallet password:

[oracle@db193]$ mkstore -wrl . -viewEntry oracle.security.client.password1
Oracle Secret Store Tool Release 19.0.0.0.0 - Production
Version 19.3.0.0.0
Copyright (c) 2004, 2019, Oracle and/or its affiliates. All rights reserved.
Enter wallet password: T1s1s@WalletPassword
oracle.security.client.password1 = T1s1s@UserPassword

There’s no magic. This is still password authentication and the passwords needs to be read. But that’s better than having it hardcoded in scripts and command lines.

So, now it is easy to connect without mentioning the user and password but only the service and the location of the wallet:

[oracle@db193]$ sql /@myatp_low?TNS_ADMIN=/home/oracle/mywallet
SQLcl: Release 19.1 Production on Wed May 08 20:27:25 2019
Copyright (c) 1982, 2019, Oracle.  All rights reserved.
Connected to:
Oracle Database 18c Enterprise Edition Release 18.0.0.0.0 - Production
Version 18.4.0.0.0
SQL> show user
USER is "FRANCK"
SQL>

the service has been found in the tnsnames.ora and the password in the credentials (sqlnet.ora was not used there, so no need to configure it).

Did you forget to allocate Huge Pages on your PostgreSQL server?

$
0
0

This short post is for those who answered ‘keep the default’ in the following. Because the default (which is no huge page allocated) is not good for a database.

When you install a Linux server, by default, there are no Huge Pages defined until you set vm.nr_hugepages in /etc/sysctl.conf and reboot or ‘sysctl -p’.

When you install PostgreSQL, by default, huge_pages=try which means that the postgres server will start with no error nor warning when huge pages are not available. This is mostly the equivalent of ‘LARGE_PAGES=TRUE’ in Oracle, except that Oracle will try to allocate as much as possible in Huge Pages.

This setting can be considered safer in case of unplanned reboot: prefer starting in degraded mode rather than not starting at all. But the risk is that you do not realize when the shared buffers are allocated in small pages.

Where?

First, how to know if the shared buffers were allocated in small or large pages? They are shared, and then show in pmap with ‘s’ mode. Here is my pmap output when allocated as Huge Pages:

$ pmap $(pgrep postgres) |  grep -E -- "-s- .*deleted" | sort -u
00007fa05d600000 548864K rw-s- anon_hugepage (deleted)

Here is the same when allocated as small pages:

$ pmap $(pgrep postgres) |  grep -E -- "-s- .*deleted" | sort -u
00007f129b289000 547856K rw-s- zero (deleted)

As far as I know, there’s no partially allocated shared buffer: if there are not enough huge pages for the total, then none are used.

How?

In order to set it, that’s easy. You set the number of 2MB pages in /etc/sysctl.conf and allocate with ‘sysctl -p’. Here is how I check the size of the memory area, from /proc/meminfo but formatted for humans.

/proc/meminfo formatted for humans

How much? That’s simple: Enough and not too much.

Enough means that all shared buffers should fit. Just take the sum of all shared_buffers for all instances in the server. If you have other programs using shared memory and allocating it large pages, they count as well. And don't forget to update when you add a new instance or increase the memory for an existing one.

Not too much because the processes also need to allocate their memory as small pages and what is reserved for huge pages cannot be allocated in small pages. If you do not leave enough small pages, you will have many problems and may even not be able to boot. Like this:

Kernel panic - not syncing: Out of memory and no killable processes - Blog dbi services

In addition to that, PostgreSQL does not support direct IO and needs some free memory for the filesystem cache, which are small pages. The documentation still mentions that postgres shared buffers should leave the same amount of RAM for filesystem cache (which means double buffering).

Be careful, when looking at /proc/meminfo the Huge Pages allocated by postgreSQL are free until they are used. So do not rely on HugePages_Free do your maths from the sum of shared_buffers. Use pmap to see that they are used just after starting the instance. There may be some other kernel settings to set (permissions, memlock) if allocation didn’t occur.

Why?

Do not fear it. Once you have set those areas, and checked them, they are fixed. Then no surprise if you take care. And it can make a big difference in the performance and memory footprint. The shared buffers have the following properties:

  • they are big, and allocating 1GB, 10GB or 100GB in 4k pages is not reasonable. Huge Pages are 2MB.
  • they are shared, and mapping so many small pages from many processes is not efficient. Takes lot of memory just to map them, increases the chance of TLB misses,…

I’ll use Kevin Closson pgio (https://kevinclosson.net) to show how to test.

Sneak Preview of pgio (The SLOB Method for PostgreSQL) Part IV: How To Reduce The Amount of Memory In The Linux Page Cache For Testing Purposes.

Here’s my pgio.conf:

$ grep -vE "^[[:blank:]]*#|^$" pgio.conf
UPDATE_PCT=0
RUN_TIME=60
NUM_SCHEMAS=2
NUM_THREADS=2
WORK_UNIT=255
UPDATE_WORK_UNIT=8
SCALE=100M
DBNAME=pgio
CONNECT_STRING=pgio
CREATE_BASE_TABLE=TRUE
$ sh ./setup.sh
Job info:      Loading 100M scale into 2 schemas as per pgio.conf->NUM_SCHEMAS.
Batching info: Loading 2 schemas per batch as per pgio.conf->NUM_THREADS.
Base table loading time: 0 seconds.
Waiting for batch. Global schema count: 2. Elapsed: 0 seconds.
Waiting for batch. Global schema count: 2. Elapsed: 1 seconds.
Group data loading phase complete.         Elapsed: 1 seconds.

I have set up two 100M schemas. My shared_buffers is 500MB so all reads are cache hits:

2.7 million LIOPS (Logical Reads Per Second) here. The advantage of pgio benchmark is that I focus exactly on what I want to measure: reading pages from the shared buffer. There’s minimal physical I/O here (should be zero but there was no warm up here and the test is too short), and minimal processing on the page (and this is why I use pgio and not pgbench here).

I have disabled Huge Pages for this test.

$ grep -E "(shared_buffers|huge_pages).*=" $PGDATA/postgresql.conf
shared_buffers=500MB
#shared_buffers = 128MB # min 128kB
#huge_pages = try # on, off, or try
huge_pages=off

Now enabling them. I keep the ‘try’ default and check that they are used. I could have set huge_pages to true to be sure.

$ sed -ie '/^huge_pages/d' $PGDATA/postgresql.conf
$ grep huge_pages $PGDATA/postgresql.conf
#huge_pages = try # on, off, or try
$ pg_ctl -l $PGDATA/logfile restart
waiting for server to shut down.... done
server stopped
waiting for server to start.... done
server started
$ pmap $(head -1 $PGDATA/postmaster.pid) | sort -hk2 | tail -4 | grep -E "^|-s-"
00007fb824d4e000 20292K r-x-- libicudata.so.50.1.2
00007fb81cc3f000 103592K r---- locale-archive
00007fb7fb200000 548864K rw-s- anon_hugepage (deleted)
total 800476K

Then I run the same test:

Here, even with a small shared memory (500MB) and only 4 threads, the difference is visible: the cache hits performance on the small pages is only 2719719/3016865=90% of what is achieved with large pages.

Those screenshots are from a very small demo to demonstrate how to do it. If you need real numbers, run this on a longer run, like RUN_TIME=600. And on your platform, because of the overhead of large shared memory allocated in small pages depends on your CPU, your OS (with the patches to mitigate the CPU security vulnerabilities), your hypervisor,…

One thing is certain: any database shared buffer cache should be allocated in pages larger than the default. Small (4k) pages are not there for large allocations of shared areas above GigaBytes. And the second advantage is that they will never be written to swap: you allocate this memory to reduce disk I/O, and consequently, you don’t want it to be written to disk.

There’s a very nice presentation on this topic by Fernando Laudares Camargos:

FOSDEM 2019 - Hugepages and databases

I ‘fixed’ execution plan regression with optimizer_features_enable, what to do next?

$
0
0

Here is a simple example of using Mauro Pagano ‘pathfinder’ tool where you don’t really want to run the query, but just get the execution plan with all variations of optimizer settings. That’s something I used many times in situations similar to this one:

  • the database was upgraded, say from 11.2.0.4 to 19.3
  • one (or a few) SQL statements have problematic performance regression
  • the execution plan (in 19.3) is different than from the previous version (11.2.0.4) — you get both with SQL Tuning Sets or AWR
  • you set optimizer_features_enable to 11.2.0.4 and the old plan with acceptable performance is back

That’s a quick workaround, thanks to this unique Oracle Optimizer feature which let us run the latest version of the database with a previous version of the optimizer code. But the goal is not to stay long like this. Once the service is made acceptable again with this temporary setting, the second step is to understand which bug or feature is responsible for the change. Then, at least, the workaround can be limited to only one underscore setting instead of the generic optimizer_features_enable which sets hundreds of them. The third step then will be to fix the root cause, of course, and understanding what was wrong will help.

This post is about the second step — going from the general optimizer_features_enable to a unique focused setting.

This is something I wanted to write for a long time but I was always in a rush when encountering this kind of problem. But I’m currently attending Mike Dietrich upgrade workshop at AOUG conference in Vienna and this, the change of execution plan, is addressed by the exercises. Mike exposes the tools that can be used to compare the performance before and after the upgrade: capture the statements and performance statistics and compare them, and to fix them with SQL Plan Management.

The workshop instructions are on Mike’s blog:

HOL 19c - Main Index Page

If you did the workshop you have seen that the query sql_id=13dn4hkrzfpdy has a different execution plan between 11g and 19c and the idea of the lab is to fix the previous plan with a SQL Plan Baseline. That’s perfect, but I was curious about the reason for this execution plan change. There are many new features or fixes between 11.2.0.4 and 19.3 and one is probably responsible for that.

This is where Mauro Pagano ‘pathfinder’ can be used. Setting optimizer_features_enable is a shortcut to set all individual features or fixes, and pathfinder will try each of them one by one.

The query with a plan regression was:

SQL Details:
-----------------------------
Object ID : 34
Schema Name : TPCC
Container Name : Unknown (con_dbid: 72245725)
SQL ID : 13dn4hkrzfpdy
Execution Frequency : 3273
SQL Text :
SELECT COUNT(DISTINCT (S_I_ID)) FROM ORDER_LINE, STOCK
WHERE OL_W_ID = :B2 AND OL_D_ID = :B4 AND (OL_O_ID < :B3
) AND OL_O_ID >= (:B3 - 20) AND S_W_ID = :B2 AND S_I_ID =
OL_I_ID AND S_QUANTITY < :B1

The plan before and after, as reported by AWR Diff Report are the following:

And my goal is to understand which feature or fix control, when disabled, gets back to the plan hash value 954326358 instead of 3300316041

I installed sqldb360 (open sourced by Carlos Sierra and Mauro Pagano), which contains pathfinder:

git clone https://github.com/sqldb360/sqldb360.git
cd ./sqldb360/sql/

I changed the script.sql to put my query there with an EXPLAIN PLAN because I don’t want to execute it (which would require parameters):

alter session set current_schema=TPCC;
explain plan for
SELECT /* ^^pathfinder_testid */
COUNT(DISTINCT (S_I_ID)) FROM ORDER_LINE, STOCK
WHERE OL_W_ID = :B2 AND OL_D_ID = :B4 AND (OL_O_ID < :B3
) AND OL_O_ID >= (:B3 - 20) AND S_W_ID = :B2 AND S_I_ID =
OL_I_ID AND S_QUANTITY < :B1

By default, pathfinder executes the query and gets the execution plan with dbms_xplan.display_cursor, using the tag in the comment to identify it.

Here I’m doing an EXPLAIN PLAN and then I changed the pathfinder.sql to use dbms_xplan.display. My change in the ‘xplan driver’ is the following:

I’ve left the old query, but add the following one to be executed:

-- my addition there
PRO .
PRO SELECT RPAD('explain plan', 11) inst_child, plan_table_output
PRO FROM TABLE(DBMS_XPLAN.DISPLAY('PLAN_TABLE', NULL, 'ADVANCED'))
-- done
PRO /

Then running pathfinder:

[oracle@hol]$ sqlplus / as sysdba @ pathfinder.sql '"/ as sysdba"'

This takes some time to test all settings for optimizer underscore parameters (632 ones here in 19.3) and fix controls (1459 here):

The result is a zip file containing an index and the detail of each test.

The index (00001_pathfinder_upgr_20190515_1113_index.html) has one line per combination and it is easy to search from the plan hash value:

My old plan is chosen when _optimizer_partial_join_eval is set to false:

And now, I have a better workaround. Instead of setting the optimizer_feature_enable, I can set only:

ALTER SESSION SET "_optimizer_partial_join_eval" = FALSE;

Of course, my search for the plan hash value also highlights which versions set the same:

The goal of this post is to show the tool. If you want to know more about Partial Join Evaluation, Google tells me that I blogged about this in the past:

Partial Join Evaluation in Oracle 12c - Blog dbi services

The query here, a count(distinct) on a join, is subject to this optimization which changes the join to a semi-join.

If I can change the query, maybe I’ll prefer to disable it with a hint. If I click on the baseline plan from the pathfinder index, I can see the plan with hints:

Then probably a NO_PARTIAL_JOIN can disable this feature.

Side remark: you can see OPTIMIZER_FEATURES_ENABLE(‘19.1.0') but I told you that I’m on 19.3, right? And that this is the pathfinder baseline without any session setting. I didn’t expect 19.3 there because Release Updates should not add features that change the execution plan. But I expected something like ‘19.0.0’. The magic of the new release model…

In summary:

  • Pathfinder is easy to run, give it a try when you need to understand why an execution plan has changed.
  • Do the Mike Dietrich hands-on lab: upgrade is something to exercise before doing it in production.
  • Since 8i, the Oracle Optimizer developers add a flag for any change, in order to give us the possibility to enable or disable the feature or the fix. And you control it at instance, session or query level. This is a unique feature you do not find on other database systems. And it can save your business because a critical regression can always happen after an upgrade.
  • AOUG conference had a great idea with the ‘workshop and live-demo’ day before the conference day. Fewer attendees and more interaction with the speakers.

GG, this approach(pathfinder) can be used with GTT.

$
0
0

GG, this approach(pathfinder) can be used with GTT. You can fill relevant data in the script.sql before the statement that is taggued.


Do you know what you are measuring with pgbench?

$
0
0
pgbench flamegraph

pgbench is a benchmark application for PostgreSQL. You define some parameters for the workload (read-only, volume of data, number of threads, cursor sharing, …) and measure the number of transactions per second. Pgbench is used a lot when one wants to compare two alternative environments, like different postgres version, different platform, different table design,…

However, a scientific approach should go beyond the simple correlation between the observed performance (transactions per seconds) and the configuration. Without a clear analysis and explanation on the cause-consequence, we cannot extrapolate from a single set of observations to a general recommendation. The goal of this post is to show what is behind this ‘transaction per second’ measure.

pgio flamegraphs

I’ll run another benchmark tool focused at the platform: Kevin Closson pgio, which is designed exactly for this analysis. Rather than trying to simulate all layers of an application (like pgbench) we can focus at a specific component: the PostgreSQL shared buffer cache, or the OS filesystem cache, or the storage access,…

I’m using Brendan Gregg FlameGraph here to visualize the full stack sampled by perf record

brendangregg/FlameGraph

with the following flags:

perf record --call-graph dwarf -F99 -e cpu-cycles -a

I’ve compiled PostgreSQL server with the following flags:

./configure CFLAGS=" -fno-omit-frame-pointer" --enable-debug

pgbench

I’ve initialized the pgbench database with a small scale (about 100MB) as it is the only setting where we can focus the pgbench activity: with a small size, I’ll have no physical reads:

pgbench --initialize --scale=8 pgio

In the same idea, I run a read-only workload, with 12 threads:

pgbench --no-vacuum --select-only --protocol=prepared --client=12 --jobs=12 --time=120 pgio &

Then, after waiting a few minutes for the warm-up, I record perf events:

sudo perf record --call-graph dwarf -F99 -e cpu-cycles -a \
-o /tmp/perf.data sleep 60

The result is parsed to produce a flamegraph of stack samples:

sudo perf script -i /tmp/perf.data | ./stackcollapse-perf.pl | ./flamegraph.pl --width=1200 --hash --cp

Here is the result (.svg)

This is what happened in the system during the pgbench test. Pgbench, the client, spends its time on PQsendQueryPrepared and PQconsumeInput, which is the minimum that can be done with an OLTP-like well-tuned application. I’ve run with ‘--protocol=prepared’ to avoid parsing overhead which is not what I want to measure.

The postgres process is running the backend. And this is where we can realize that the real database work (run DML and commit) is not where this pgbench spending its time. Less than 15% of samples in the backend executor (ExecScan) and 6% on the CommitTransaction (even if it is a select-only workload there’s a commit here). Remains the ReadyForQuery and pq_getbyte which are about frontend-backend communication.

If you run a benchmark to measure something else than the network roundtrips and context switches involved in the client/server communication, then this pgbench workload is not the right tool.

If you benchmark to compare the CPU and RAM activity, for example because you want to choose the best compute shape from your cloud provider, then you need to run something that is focused at this activity, in a sustainable way.

pgio

I’ll use Kevin Closson ‘pgio’ which is the same approach as his ‘SLOB’ for Oracle:

SLOB Resources

The settings in pgio.conf are similar in size and number of threads (I don’t want physical I/O and this stays in cache):

UPDATE_PCT=0
RUN_TIME=60
NUM_SCHEMAS=1
NUM_THREADS=12
WORK_UNIT=255
UPDATE_WORK_UNIT=8
SCALE=100M
DBNAME=pgio
CONNECT_STRING=pgio
CREATE_BASE_TABLE=TRUE

The setup and run is easy, and again I record perf events after a little warmup:

sh ./setup.sh
sh ./runit.sh &
sudo perf record --call-graph dwarf -F99 -e cpu-cycles -a \
-o /tmp/perf.data sleep 60

Same flamegraph (using same colors):

sudo perf script -i /tmp/perf.data | ./stackcollapse-perf.pl | ./flamegraph.pl --width=1200 --hash --cp > /tmp/perf.svg

And here is the .svg result:

There’s no frontend work here because of all runs from a PL/pgSQL loop and then no roundtrip, network and context switch is there to influence my measures. Most of the activity is in the query executor, accessing the shared buffers. This is what you want if you want to compare some platform configurations like:

  • cloud compute shapes
  • NUMA
  • large pages
  • memory settings
  • filesystem cache
  • compression / encryption
  • various intel security bugs mitigation patches

And instead of ‘transaction per second’ pgio will measure the number of buffers read per second and the cache hits.

In summary…

Pgbench is not the tool if you want to measure specific platform components, or the postgres components interfacing with the system (buffer cache, WAL, writer, …). Pgbench can be used to test the database for the application. But in all case, one number like ‘transactions per second’ is not sufficient. FlameGraph can help to visualize what is involved behind this measure.

Generate your Oracle Secure External Password Store wallet from your tnsnames.ora

$
0
0

Want to connect passwordless with SQLcl to your databases from a single location? Here is a script that creates the Secure External Password Store wallet credentials for each service declared in the tnsnames, as well as shell aliases for it (as bash does autocompletion). The idea is to put everything (wallet, sqlcl,…) in one single directory that you must protect of course because read access to the files is sufficient to connect to your databases.

Download the latest SQLcl from:

SQLcl Downloads

And install the Oracle Client if you do not have it already:

Oracle Instant Client Downloads

Now here is my script that:

  • reads the tnsnames.ora (define the location)
  • define sqlnet.ora and tnsnames.ora (ifile to the original one)
  • creates the password wallet
  • generates a script to define all aliases
  • create a login.sql

All that is located in the sqlcl directory (here under my $HOME) and the aliases have everything to point here (TNS_ADMIN and SQLPATH)

# this is where your tnsnames.ora is found
TNS_ADMIN=/etc
# unzip -d ~ sqlcl-19.1.0.094.1619.zip
#
# if "Error Message = no ocijdbc18 in java.library.path" see https://martincarstenbach.wordpress.com/2019/05/20/using-the-secure-external-password-store-with-sqlcl/
#
alias sqlcl='TNS_ADMIN=~/sqlcl SQLPATH=~/sqlcl ~/sqlcl/bin/sql -L -oci'
#
cat > ~/sqlcl/sqlnet.ora <<CAT
WALLET_LOCATION=(SOURCE=(METHOD=FILE)(METHOD_DATA=(DIRECTORY="$HOME/sqlcl")))
SQLNET.WALLET_OVERRIDE=TRUE
CAT
#
cat > ~/sqlcl/tnsnames.ora <<CAT
ifile=$TNS_ADMIN/tnsnames.ora
CAT
#
cat > ~/sqlcl/login.sql <<'CAT'
set exitcommit off pagesize 5000 linesize 300 trimspool on sqlprompt "_user'@'_connect_identifier> "
set sqlformat ansiconsole
CAT
#
read -p "Enter SYS password to store in the wallet: " -s PASSWORD
# Create the wallet
mkstore -wrl ~/sqlcl -create <<END
$PASSWORD
$PASSWORD
END
# Add services to wallet
awk -F"," '/^[^ #\t].*=/{sub(/=.*/,""); for (i=1;i<=NF;i++){print $i}}' $TNS_ADMIN/tnsnames.ora | while read service
do
echo "=== Adding $service to wallet for passwordless connection like: /@$service as sysdba"
mkstore -wrl ~/sqlcl -createCredential $service SYS <<END
$PASSWORD
$PASSWORD
$PASSWORD
END
done
# list services from wallet
{
mkstore -wrl ~/sqlcl -listCredential <<END
$PASSWORD
END
} | awk '/^[0-9]+: /{print "alias sysdba_"tolower($2)"="q"TNS_ADMIN=~/sqlcl SQLPATH=~/sqlcl ~/sqlcl/bin/sql -L -oci /@"toupper($2)" as sysdba"q}' q="'" qq='"' | sort | tee ~/sqlcl/
services.sh
#
unset PASSWORD

Then just source the generated services.sh to create aliases for each service (like sysdba_xxx). This example creates connections as sysdba with the SYS authentication, but it is highly recommended to have your own user. Of course the idea here is that the same password is used on all databases, but that again can be customized.

When I don’t want to use an alias (from a script for example) I also have a chmod u+x script in my path to run sqlcl with this environment

TNS_ADMIN=~/sqlcl SQLPATH=~/sql ~/sqlcl/bin/sql -L -oci ${@:-/nolog}

and SQLcl has also autocompletion for the connect command (from the tnsnames.ora).

If you have a “no ocijdbc18 in java.library.path” message, then look at Martin Bach blog:

Using the Secure External Password store with sqlcl

If you have credentials to connect to the Oracle Cloud, use the downloaded wallet instead of creating one with mkstore.

PostgreSQL: measuring query activity(WAL size generated, shared buffer reads, filesystem reads,…)

$
0
0

PostgreSQL: measuring query activity (WAL size generated, shared buffer reads, filesystem reads,…)

When I want to know if my application scales, I need to understand the work done by my queries. No need to run a huge amount of data from many concurrent threads. If I can get the relevant statistics behind a single unit-test, then I can infer how it will scale. For example, reading millions of pages to fetch a few rows will cause shared buffer contention. Or generating dozens of megabytes of WAL for a small update will wait on disk, and penalize the backup RTO, or the replication gap.

I’ll show some examples. From pgsql I’ll collect the statistics (which are cumulative from the start if the instance) before:

select *,pg_current_wal_lsn() from pg_stat_database where datname=current_database() \gset

and calculate the difference to show the delta:

select blks_hit-:blks_hit"blk hit",blks_read-:blks_read"blk read",tup_inserted-:tup_inserted"ins",tup_updated-:tup_updated"upd",tup_deleted-:tup_deleted"del",tup_returned-:tup_returned"tup ret",tup_fetched-:tup_fetched"tup fch",xact_commit-:xact_commit"commit",xact_rollback-:xact_rollback"rbk",pg_size_pretty(pg_wal_lsn_diff(pg_current_wal_lsn(),:'pg_current_wal_lsn')) "WAL",pg_size_pretty(temp_bytes-:temp_bytes)"temp" from pg_stat_database where datname=current_database();

Most of the statistics come from pg_stat_database. The WAL size is calculated from the latest WAL write pointer exposed with pg_current_wal_lsn() and size calculated with pg_wal_lsn_diff(). I use \gset to get them as plsql substitution variables before and used them to get the difference after.

Better with examples, I create a DEMO database and a DEMO table:

demo=# create table DEMO(n int primary key,flag char,text varchar(1000));
CREATE TABLE

Insert 1000 rows:

I’ve run the following insert:

insert into DEMO
select generate_series, 'N',lpad('x',1000,'x') from generate_series(1,10000);
INSERT 0 10000

But I’ve run my queries before and after in order to get the statistics:

I’ve inserted about 10MB of data (10000 rows with a 1000 bytes text and some additional small columns). All those new rows bust be logged by the WAL, which is the reason for the 11MB of redo information. The pages where it was written had to be read from disks in order to update them, which is the reason for 1504 block reads (that’s about 11MB in 8k blocks). Actually, we see 30000 additional block hits in buffer cache and this is the index maintenance. Those 10000 rows were inserted one by one, updating the B*Tree index which may have a height of 3 and that’s 30000 pages touched. Fortunately, they stayed in the shared buffers which is why there’s no block read each time.

This matches with the size of my table:

select relkind,relname,relpages,pg_size_pretty(relpages::bigint*8*1024) from pg_class natural join (select oid relnamespace,nspname from pg_namespace) nsp where nspname='public';

11MB of data, nearly 1500 pages — that’s what I got from the statistics.

Count the rows

Now, I’ll check how many blocks have to be read when counting all rows:

select count(*) from DEMO ;

All table blocks were read, fortunately from the shared buffers. And the reason is in the explain plan: full table scan. Actually, I would expect an Index Only scan for this query because all rows can be counted from the index. But MVCC implementation of PostgreSQL is versioning only the table tuples. Not the index entries, and it has to go to the table, unless a recent vacuum has updated the visibility map.

Vacuum

Let’s vacuum to update the visibility map:

vacuum DEMO;

Many block reads, that’s like a full table scan, with minimal updates here because there’s no dead tuples to remove.

Count from vacuumed table

Now, counting the rows again:

select count(*) from DEMO ;

Finally I have a real Index Only scan, accessing only to 45 buffers to count the 10000 index entries. That’s the most important point with PostgreSQL performance: MVCC allows to mix read and write workloads, thanks to non-blocking reads, but ideally, a vacuum should occur between massive write and massive read use-cases. Again, no need to run a massive pgbench concurrent workload to observe this. Small queries are sufficient as long as we look at the right statistics.

Update

I update the ‘flag’ column to set half of the rows to ‘Y’:

update DEMO set flag='Y' where n%2=0;

This is the operation where PostgreSQL MVCC is less efficient. I changed only one byte per row, but all rows were copied to new blocks. As I’m touching half the rows, they fit in half the blocks. This is the 743 read from disk. And the old version had to be marked as so… finally, nearly 30000 buffer access to update 5000 flags. And the worse is the redo generation. 16MB as the new tuples must be logged, as well as the old versions marked. And PostgreSQL must do full page logging even when few rows/columns are modified. More about this:

Full page logging in Postgres and Oracle - Blog dbi services

In this previous blog I was using strace to get the size of WAL written. Now using the delta offset of WAL pointer is see the same figures.

Delete

Now deleting the non-flagged rows

delete from DEMO where flag='N';

Deleting 5000 rows here, has to scan all blocks to find them (that’s the 10000 tuples returned) which is about 1500 buffers accessed. And for the 5000 found, mark them as deleted, which is 5000 additional buffers accessed.

Why?

This post is there mainly to show the simple query I use to get SQL execution statistics, including WAL writes which are probably the most useful, but unfortunately missing from pg_stat_database. I’m also advocating here for small test cases fully understood rather than general benchmarks difficult to analyze. It is, in my opinion, the best way to understand how it works, both for educational purpose and to guarantee scalable applications.

When Oracle Statistic Gathering times out.

$
0
0

In a previous post, I explained how to see where the Auto Stats job has been running and timed out:

SYS.STATS_TARGET$

I got a case where it always timed out at the end of the standard maintenance window. One table takes many hours, longer than the largest maintenance window, it will always be killed at the end. And, because it stayed stale, and staler each day, this table was always listed first by the Auto Stat job. And many tables never got their chance to get their stats gathered for … years.

In that case, the priority is to gather statistics. That can be long. Then I run the job manually:

exec dbms_auto_task_immediate.gather_optimizer_stats;

Here, it will never time-out (and the auto job will not start at maintenance window start). This manual gathering can take many days. Of course, this gives time to think about a solution, like reading Nigel Bayliss recommendations:

How to Gather Optimizer Statistics Fast!

If I want to kill the manual job, because one table takes really too long and I decide to skip it for the moment, here is my query to find it:

select 'alter system kill session '''||sid||','||serial#||',@'||inst_id||''' /* '||action||' started on '||logon_time||'*/;' "Kill me with this:" from gv$session where module='DBMS_SCHEDULER' and action like 'ORA$AT^_OS^_MANUAL^_%' escape '^';

Which gives me the kill statement, and the time when I started it:

Before killing, I’ll check the long queries from it with the goal to find a solution for it:

select executions,users_executing,round(elapsed_time/1e6/60/60,1) hours,substr(coalesce(info,sql_text),1,60) info,sql_id from gv$sql natural left outer join (select address,hash_value,sql_id,plan_hash_value,child_address,child_number,id,rtrim(operation||' '||object_owner||' '||object_name) info from gv$sql_plan where object_name is not null) where elapsed_time>1e6*10*60 and action like 'ORA$AT_OS_%' order by last_active_time,id

In this example, I can see that one table is running for 4 days:

Now I kill this statistic gathering job. What I want for the moment is to exclude this table from the automatic statistics gathering. Unfortunately, I cannot change the AUTOSTATS_TARGET at table level, then I lock the stats. And run DBMS_AUTO_TASK_IMMEDIATE.GATHER_OPTIMIZER_STATS again.

This is just to quickly resolve the gap we had on many tables. The few tables locked will need further considerations. I even got a funny case where the statistics gathering was long because… statistics where stale. It was in 11g, an IOT where the CBO decided to with ‘db file sequential reads’. I deleted the statistics and the gathering used an optimized execution plan then. When you have really bad statistics, it may be better to have no statistics (and then do dynamic sampling) rather than completely stale ones.

Hibernate for Oracle DBAs

$
0
0

Warning: any smart developer may feel sick when reading this ;)

I am not a developer, but I like to discuss with developers: share my side of the IT (the database that we want rock stable and durable) and listen to their side (the application that they want easy to maintain and evolve). And, as I like to understand what I’m talking about, I often need to test some snippets.

Many DBAs complain about Hibernate when they come upon the queries generated by a wrong mapping. They think it was designed to be bad (who would do that?). And they are convinced that JDBC and SQL are sufficient to build applications. Actually, many DBAs I have seen are persuaded that they understand everything about coding because they have written some ugly PERL scripts to automate their job. And that anything going beyond has the only goal to break the database.

I didn’t go this way. As I like to understand before building my opinion, I have read “Hibernate In Action” and tested some object to relational mapping. I’m talking about Hibernate 3 times here. I’ve found those tests in a folder from 2008. I re-used this today for a short test and that’s the reason for this post.

Here I am showing how I’m doing those small tests with Hibernate. I’m a DBA and I cannot have an Eclipse environment taking all my screens, hiding those database top activity charts. And all my RAM is already eaten by SQL Developer and Chrome Grid Control windows, no room for Eclipse. And anyway, those mouse-focused IDEs are not friends with my carpal tunnel. I like the keyboard and tty.

So, for simple tests, I need simple things which can be reduced to a command line and 1 file that I can open with vi. The goal of this post is to show how it is easy to test some Hibernate thing in this case. Of course, any real developer will vomit when looking at this… don’t forget this is about short tests only.

Libraries

So, no Maven for me. I download the whole Hibernate .zip and build a CLASSPATH with everything I found in the required lib folder.

wget https://netix.dl.sourceforge.net/project/hibernate/hibernate-orm/5.4.3.Final/hibernate-release-5.4.3.Final.zip
unzip hibernate-release-5.4.3.Final.zip
for i in hibernate-release-5.4.3.Final/lib/required/*.jar 
do
CLASSPATH="${CLASSPATH}:$i"
done
export CLASSPATH=.:$ORACLE_HOME/jdbc/lib/ojdbc8.jar:$CLASSPATH

You can see that I’ve added the Oracle JDBC as I’ll connect to an Oracle database that I have locally (I use Oracle Cloud DBaaS here).

Compile

No Ant here. I compile the .java files I have in my folder (I don’t use packages and subfolders for simple tests). Note that, from a past admiration for makefiles, I add enough intelligence (like “test -nt”) to compile only when the code is newer than the source.

for i in *.java
do
if [ $i -nt $(basename $i .java).class ]
then
$ORACLE_HOME/jdk/bin/javac $i
fi
done

ORM Mapping

My goal was to quickly test the following mapping from @vlad_mihalcea:

The best way to map a Composite Primary Key with JPA and Hibernate - Vlad Mihalcea

So what do I have in those .java files? Testing Hibernate needs having many classes. And in Java, each class goes to its own file. But did I say that I want to open only 1 file? I use inner classes.

import java.io.*;
import java.sql.*;
import java.util.*;
import oracle.jdbc.*;
import org.hibernate.*;
import org.hibernate.cfg.*;
import javax.persistence.*;
public class Franck {
@Entity(name = "Company")
@Table(name = "company")
public class Company {
    @Id
@GeneratedValue(strategy=GenerationType.IDENTITY)
private Long id;
    private String name;
    public Long getId() {
return id;
}
public void setId(Long id) {
this.id = id;
}
public String getName() {
return name;
}
public void setName(String name) {
this.name = name;
}
@Override
public boolean equals(Object o) {
if (this == o) return true;
if (!(o instanceof Company)) return false;
Company company = (Company) o;
return Objects.equals(getName(), company.getName());
}
@Override
public int hashCode() {
return Objects.hash(getName());
}
}
@Embeddable
public class EmployeeId implements Serializable {
@ManyToOne
@JoinColumn(name = "company_id")
private Company company;
    @Column(name = "employee_number")
private Long employeeNumber;
    public EmployeeId() {
}
public EmployeeId(Company company, Long employeeId) {
this.company = company;
this.employeeNumber = employeeId;
}
public Company getCompany() {
return company;
}
public Long getEmployeeNumber() {
return employeeNumber;
}
@Override
public boolean equals(Object o) {
if (this == o) return true;
if (!(o instanceof EmployeeId)) return false;
EmployeeId that = (EmployeeId) o;
return Objects.equals(getCompany(), that.getCompany()) &&
Objects.equals(getEmployeeNumber(), that.getEmployeeNumber());
}
@Override
public int hashCode() {
return Objects.hash(getCompany(), getEmployeeNumber());
}
}
@Entity(name = "Employee")
@Table(name = "employee")
public class Employee {
@EmbeddedId
private EmployeeId id;
    private String name;
    public EmployeeId getId() {
return id;
}
public void setId(EmployeeId id) {
this.id = id;
}
public String getName() {
return name;
}
public void setName(String name) {
this.name = name;
}
}
public static void main(String[] args) throws SQLException {
SessionFactory sf=new Configuration()
.addAnnotatedClass(Employee.class)
.addAnnotatedClass(Company.class)
.setProperty("hibernate.connection.url","jdbc:oracle:thin:@//localhost/PDB1")
.setProperty("hibernate.connection.driver_class","oracle.jdbc.driver.OracleDriver")
.setProperty("hibernate.connection.username","demo")
.setProperty("hibernate.connection.password","demo")
.setProperty("hibernate.format_sql","true")
.setProperty("hibernate.show_sql","true")
.setProperty("hibernate.hbm2ddl.auto","create")
.buildSessionFactory();
}
}

The main class name (here Franck) matches the file name (Franck.java) and all my entities are inner classes here. After compilation here are my files:

-rwxr--r--. 1 oracle 4931 Jun  5 20:18 Franck.java
-rw-r--r--. 1 oracle 1304 Jun 5 20:19 Franck$Company.class
-rw-r--r--. 1 oracle 1398 Jun 5 20:19 Franck$EmployeeId.class
-rw-r--r--. 1 oracle 922 Jun 5 20:19 Franck$Employee.class
-rw-r--r--. 1 oracle 1557 Jun 5 20:19 Franck.class

Execution

$ORACLE_HOME/jdk/bin/java Franck

This generates the following:

That’s all I need to verify what my annotations generate with the Oracle 12c Dialect. Ugly on-file code, but sufficient for this goal.

Java as a Shell

Ok, now that I think that any real developer has stopped reading, I can confess that I add the following on the top of my .java file:

/*TAG-FOR-SHELL 2>/dev/null
CLASSPATH=.
# Oracle JDBC
CLASSPATH=${CLASSPATH}:$ORACLE_HOME/jdbc/lib/ojdbc8.jar
# Download Hibernate
[ -f /var/tmp/hibernate.zip ] || wget -O /var/tmp/hibernate.zip https://netix.dl.sourceforge.net/project/hibernate/hibernate-orm/5.4.3.Final/hibernate-release-5.4.3.Final.zip
# Unzip Hibernate
[ -d /var/tmp/hibernate*?/lib/required ] || unzip -d /var/tmp /var/tmp/hibernate.zip
# add libs to CLASSPATH
for l in /var/tmp/hibernate*?/lib/required/*.jar ; do CLASSPATH="${CLASSPATH}:$l" ; done ; export CLASSPATH
# compile all Java
for s in $(find -name "*.java"); do
s="$(basename $s .java)"
[ $s.java -nt $s.class ] && {
echo "Compiling $s..." >&2
$ORACLE_HOME/jdk/bin/javac $s.java || exit 1
}
done
# execute
$ORACLE_HOME/jdk/bin/java $(basename $0 .java)
exit
*/

And then I “chmod u+x” this .java file and run it as a shell. The shell part is included in Java comment so that this file can be compiled as Java source code. And it gets the libraries if not there already, builds CLASSPATH, compile what’s new in the directory, and run it as a Java program. all that with a simple:

./Franck.java

Any comments welcome on Twitter: @FranckPachot

Viewing all 515 articles
Browse latest View live


<script src="https://jsc.adskeeper.com/r/s/rssing.com.1596347.js" async> </script>