Quantcast
Channel: Stories by Franck Pachot on Medium
Viewing all 515 articles
Browse latest View live

PostgreSQL transaction management in procedures

$
0
0

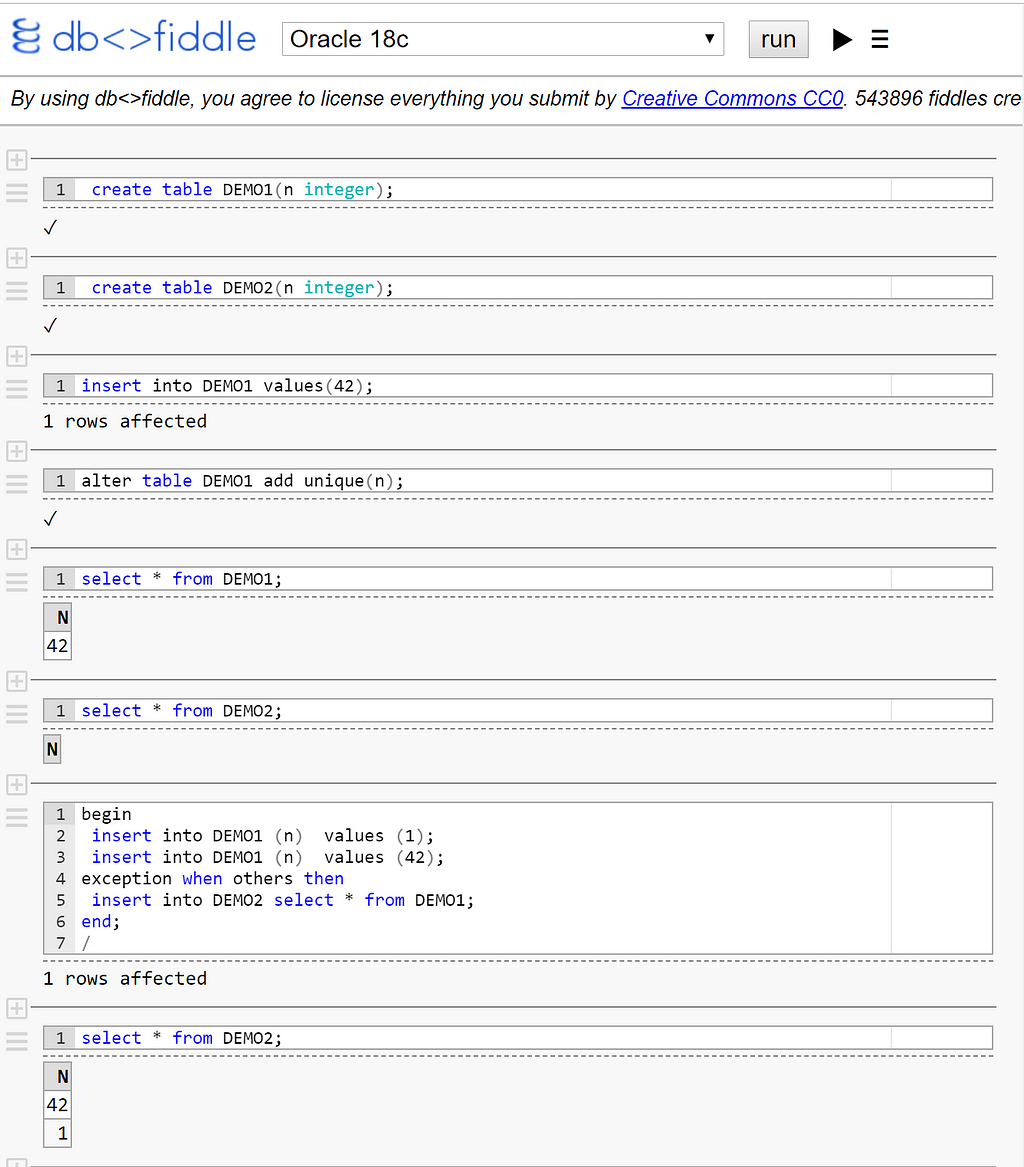
TL;DR: AUTOCOMMIT is required when calling a procedure which has some COMMIT inside.

In version 11 PostgreSQL has introduced the possibility to start, commit or rollback transactions in PL/pgSQL procedures (stored or anonymous). Most of the demos have been run from the psql default AUTOCOMMIT on, like 2ndQuadrant and dbi-services blogs. But Bryn Llewellyn (YugaByte) raised an issue when running without AUTOCOMMIT OFF (which, coming from Oracle, looks like the right choice). Here is my investigation on this.

You should read my last post Transaction management in PostgreSQL and what is different from Oracle if you are not totally familiar with PostgreSQL transaction management and auto-commit, as I wrote it as an introduction to this analysis.

Tracing with GDB

Here is what I run (I’m using the function from the previous post):

psql
\set PROMPT1 '\t\t\t\t\t\t>>>%`date +%H:%M:%S`<<<\n%/%R%# '
select pg_backend_pid();
-- attach gdb to backend and set breakpoint on exec_simple_query
\echo :AUTOCOMMIT
call my_inserts(1111,1111);
-- gdb stops on breakpoint and continue
\set AUTOCOMMIT off
call my_inserts(1112,1112);
-- gdb stops on breakpoint and continue

Here is my gdb session on a second terminal:

gdb -p $(pgrep -nl postgres)
define hook-stop
shell echo -e "\t\t\t\t\t\t>>>`date +%H:%M:%S`<<<"
end
print getpid()
break exec_simple_query
cont
## back to psql to call the procedure
print query
cont
## back to plsql to set AUTOCOMMIT off and run again

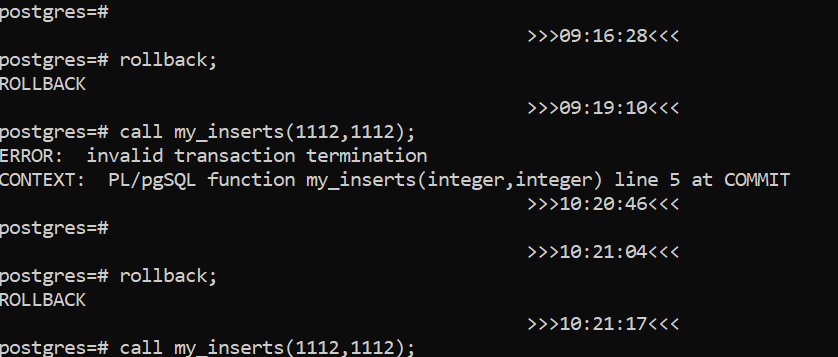
I have added timestamps in both prompts in order to show the sequence in one screenshot. Here is the result. The first call succeeded (in AUTOCOMMIT on) but the second call failed (with AUTOCOMMIT off) because psql has issued a BEGIN before the CALL:

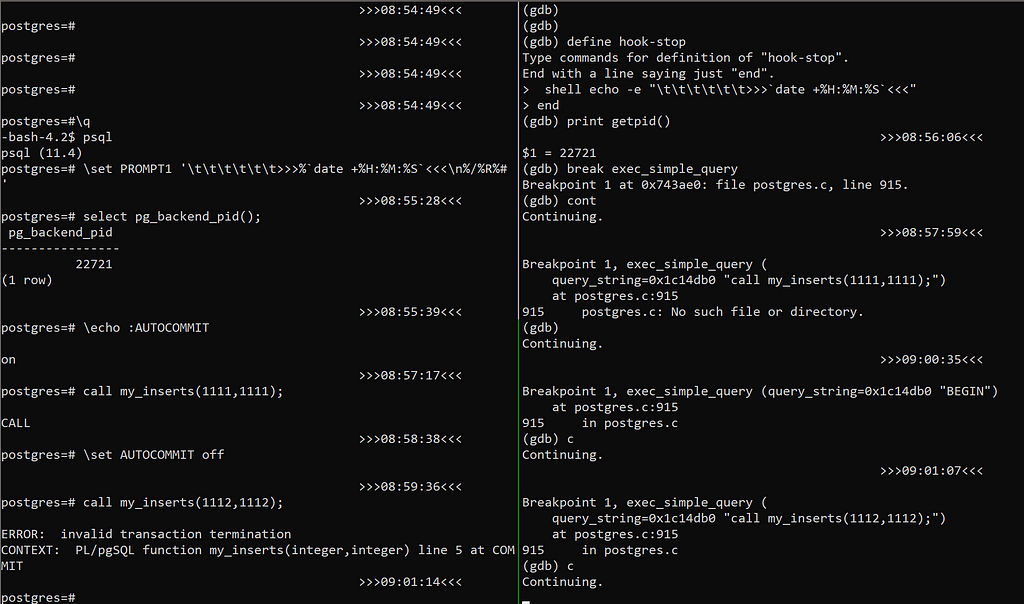
I have 2 questions here:

  • Why does psql initiates a transaction before the call when it is not in AUTOCOMMIT?
  • Why does the procedure’s COMMIT fail when in a transaction opened outside of the procedure?

Why does the COMMIT fail when in a transaction opened outside?

From the previous step, I rollback (the transaction, initiated by the client when in AUTOCOMIT off, was aborted). And call the procedure again after having set the following breakpoints:

 break SPI_start_transaction
break SPI_commit
print _SPI_current->atomic
cont

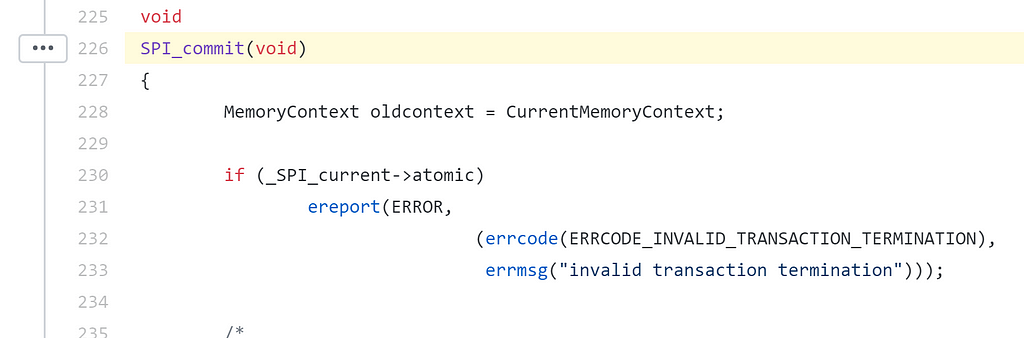
I’ve set those and displayed “atomic” because the error message comes from the following PostgreSQL code:

https://github.com/YugaByte/yugabyte-db/blob/c02d4cb39c738991f93f45f4895f588a6d9ed716/src/postgres/src/backend/executor/spi.c#L226
 set pagination off
print _SPI_current->atomic
backtrace

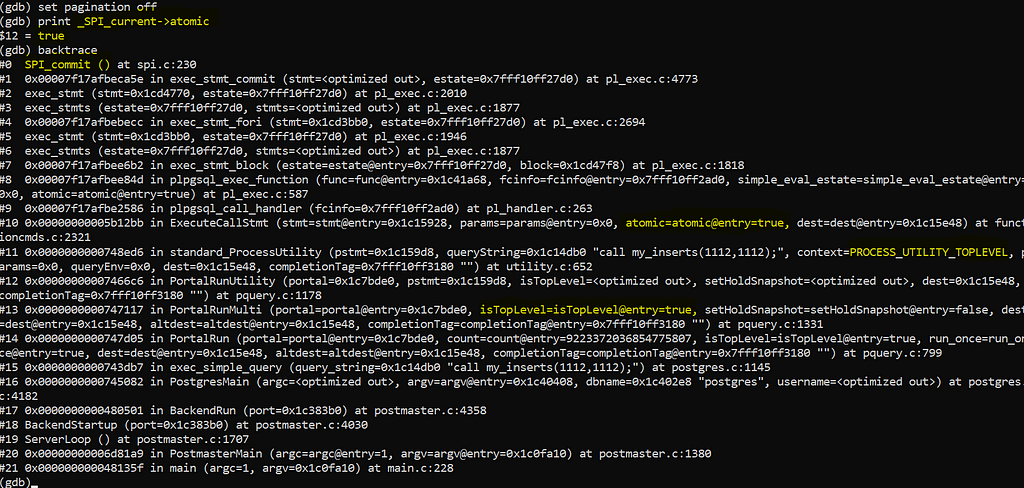
I can see atomic=true in the call to the following function

ExecuteCallStmt(CallStmt *stmt, ParamListInfo params, bool atomic, DestReceiver *dest)

and the comments in functioncmds.c explains the idea of “atomic commands” — those were transaction control commands are disallowed. Here is the postgres source code and the explanation:

YugaByte/yugabyte-db

* Inside a top-level CALL statement, transaction-terminating commands such as COMMIT or a PL-specific equivalent are allowed. The terminology in the SQL standard is that CALL establishes a non-atomic execution context. Most other commands establish an atomic execution context, in which transaction control actions are not allowed.

This makes sense. But I am in a “top-level CALL statement”, so why is atomic set to true? The parent in the stack is standard_ProcessUtility and here is how atomic is defined:

bool isAtomicContext = (!(context == PROCESS_UTILITY_TOPLEVEL || context == PROCESS_UTILITY_QUERY_NONATOMIC) || IsTransactionBlock());

Ok, I think I got it. There’s another reason to set atomic=true: I am in already in a transaction block. Just confirmed by running the same

with those additional breakpoints:

break standard_ProcessUtility
continue
print context
print IsTransactionBlock()
continue
print context
print IsTransactionBlock()

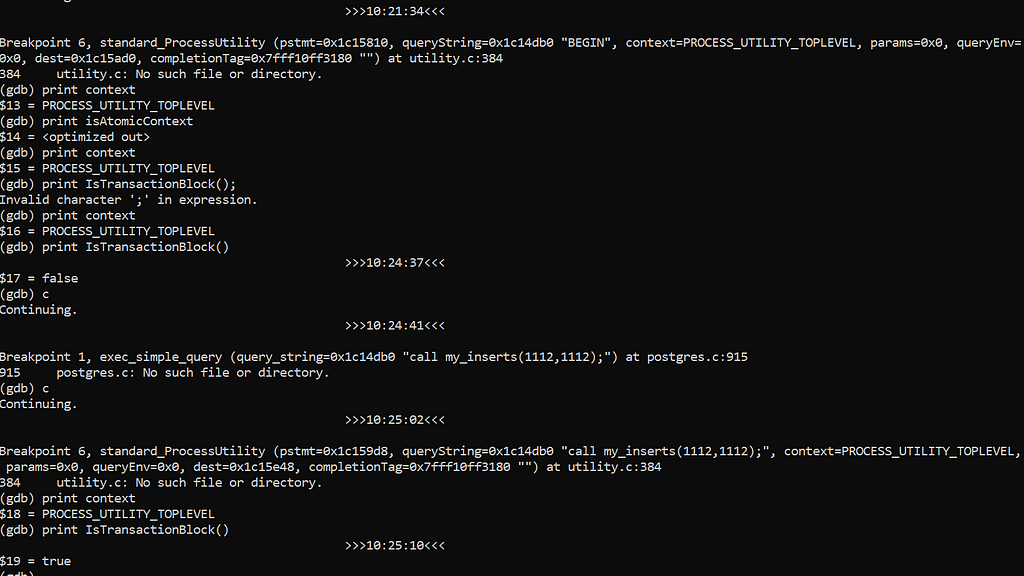
So, I am already in a transaction when executing the CALL and documentation says that:

If CALL is executed in a transaction block, then the called procedure cannot execute transaction control statements

Ok, documentation is perfect. Why did I need to gdb in order to get this? It’s more fun 🤓 and probably the error message is really bad. A generic “invalid transaction termination” because the only info that was passed is that we are in an atomic command. The error message should mention that we are either in a transaction block or in a recursive call.

While here, I’ll mention a pgsql-hackers thread about another reason why we can get the same error, because an atomic context is forced by query snapshot management: “SPI Interface to Call Procedure with Transaction Control Statements?”.

Anyway, I agree that I should not start a transaction in the client and commit it in the procedure. Transaction control should stay on the same layer. But… I never wanted to start a transaction from the client and this brings me to the second question:

Why does psql initiate a transaction before CALL?

While my psql client is still hanging (because of the breakpoint stop on the backend), on another terminal I attach gdb to it:

gdb -p $(pgrep -nl psql)
define hook-stop
shell echo -e "\t\t\t\t\t\t>>>`date +%H:%M:%S`<<<"
end
print getpid()
set pagination off
backtrace

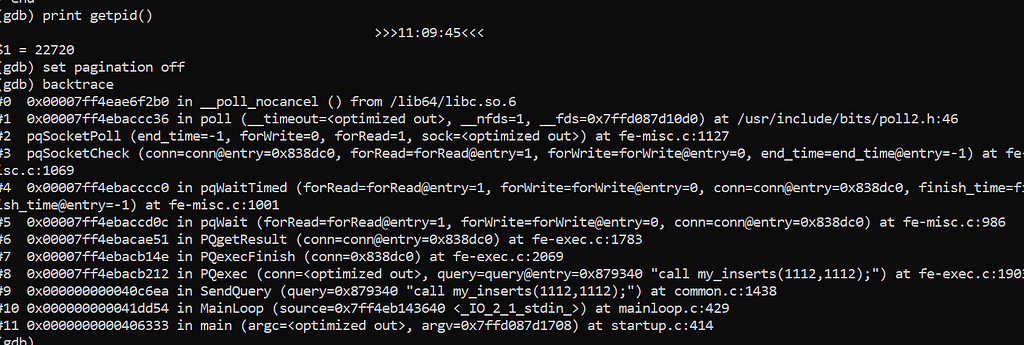
I have seen that when AUTOCOMMIT is off the backend receives a BEGIN command. This can be found in SendQuery from common.c is:

transaction_status = PQtransactionStatus(pset.db);
if (transaction_status == PQTRANS_IDLE &&
!pset.autocommit &&
!command_no_begin(query))
{
results = PQexec(pset.db, "BEGIN");

So, basically, if there’s no transaction and we are not in AUTOCOMMIT, plsql will execute a BEGIN before the command except if the command itself is a command that starts the transaction.

Here, I’m attached when the CALL command is sent and I’m already in an active transaction:

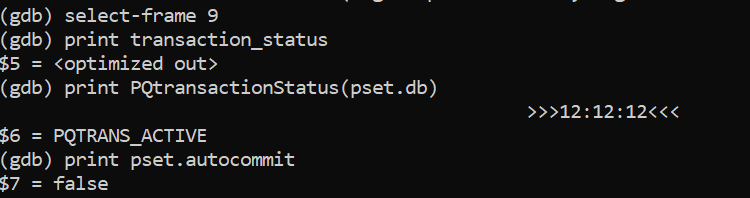
but when there’s no transaction already (PQTRANS_IDLE), then psql executes a BEGIN command, except when command_no_begin returns true. And CALL is not one of those.

Is that a psql bug or expected feature? Let’s see what happens with JDBC

What about JDBC?

JDBC drivers also have the AUTOCOMMIT set by default. I run the following:

import java.io.*;
import java.sql.*;
import java.util.*;
import java.time.*;
import oracle.jdbc.*;
public class JDBC {
public static void println(String text){
System.out.println(Instant.now().toString() +":" + text);
}
public static void main(String[] args)
throws SQLException,InterruptedException {
try (Connection c = (Connection) DriverManager.getConnection(
args[2],args[0],args[1]) // url, user, password
) {
println(" AUTOCOMMIT: "+c.getAutoCommit());
try (CallableStatement s=c.prepareCall("call my_inserts(2,3)")){
s.execute();
}
println(" DONE. ");
c.setAutoCommit(false);
println(" AUTOCOMMIT: "+c.getAutoCommit());
try (CallableStatement s=c.prepareCall("call my_inserts(4,5)")){
s.execute();
}
println(" DONE. ");
}

and here is the result of this code:

Same behavior with JDBC: the first call, with AUTOCOMMIT, succeded but then the second call, where AUTOCOMMIT is disabled, failed.

So… is that a constant behavior among all PostgreSQL clients? Let’s try Python.

What about psycopg2?

I quickly checked from a Jupyter Notebook I had from a previous blog post (iPython-SQL/SQLAlchemy/psycopg2)

Here, the transaction management in the procedure works in both cases, whatever the AUTOCOMMIT setting is. However, are we sure that I am not in auto-commit? I’ve added an additional insert after my commit in the procedure. And it seems that all was committed at the end of the call…

So what?

I started this investigation (which I didn’t expect to be so long) after Bryn Llewellyn raised the following issue at YugaByte (the SQL API of YugaByteDB, YSQL, is based and compatible with PostgreSQL):

Please explain the inscrutable rules for when "commit" in a stored proc succeeds or causes a run-time error · Issue #1957 · YugaByte/yugabyte-db

Having transaction control in PostgreSQL is a nice feature that appeared recently (PostgreSQL 11) and for the moment it seems that there are some inconsistencies between the clients. In its current state, it is designed for AUTOCOMMIT, so that the procedure itself starts and ends the transaction from the backend.

Don’t hesitate to comment and give feedback, preferably on Twitter:


MVCC in Oracle vs. Postgres, and a little no-bloat beauty

$
0
0

MVCC in Oracle vs. PostgreSQL, and a little no-bloat beauty

Databases that are ACID compliant must provide consistency, even when there are concurrent updates.

Let’s take an example:

  • at 12:00 I have 1200$ in my account
  • at 12:00 My banker runs long report to display the accounts balance. This report will scan the ACCOUNT tables for the next 2 minutes
  • at 12:01 an amount of 500$ is transferred to my account
  • at 12:02 the banker’s report has fetched all rows

What balance is displayed in my banker’s report?

You may want to display $1700 because, at the time when the result is returned, the + $500 transaction has been received. But that’s impossible because the blocks where this update happened may have already been read before the update was done. You need all reads to be consistent as-of the same point-in-time and because the first blocks were read at 12:00 the only consistent result is the one from 12:00, which is $1200.

But there are two ways to achieve this, depending on the capabilities of the query engine:

  • When only the current version of blocks can be read, the updates must be blocked until the end of the query, so that the update happens only at 12:02 after the report query terminates. Then reading the current state is consistent:

It seems that you see data as-of the end of the query, but that’s only a trick. You still read data as-of the beginning of the query. But you blocked all changes so that it is still the same at the end of the query. What I mean here is that you never read all the current version of data. You just make it current by blocking modifications.

  • When the previous version can be read, because the previous values are saved when an update occurs, the + $500 update can happen concurrently. The query will read the previous version (as of 12:00):

Here, you don’t see the latest committed values, but you can read consistent values without blocking any concurrent activity. If you want to be sure that it is still the current value (in a booking system for example), you can explicitly block concurrent changes (like with a SELECT FOR READ or SELECT FOR UPDATE). But for a report, obviously, you don’t want to block the changes.

The former, blocking concurrent modifications, is simpler to implement but means that readers (our banker’s report) will block writers (the transaction). This is what was done by DB2, or SQL Server by default and the application has to handle this with shorter transactions, deadlock prevention, and no reporting. I say “by default” because all databases are now trying to implement MVCC.

The latter, MVCC (Multi-Version Concurrency Control), is better for multi-purpose databases as it can handle OLTP and queries at the same time. For this, it needs to be able to reconstruct a previous image of data, like snapshots, and is implemented for a long time by Oracle, MySQL InnoDB and PostgreSQL.

But their implementation is completely different. PostgreSQL is versioning the tuples (the rows). Oracle does it a lower level, versioning the blocks where the rows (and the index entries, and the transaction information) are stored.

PostgreSQL tuple versioning

PostgreSQL is doing something like a Copy-On-Write. When you update one column of one row, the whole row is copied to a new version, probably in a new page, and the old row is also modified with a pointer to the new version. The index entries follow the same: as there is a brand new copy, all indexes must be updated to address this new location. All indexes, even those who are not concerned by the column that changed, are updated just because the whole row is moved. There’s an optimization to this with HOT (Heap Only Tuple) when the row stays in the same page (given that there’s enough free space).

This can be fast, and both commit or rollback is also fast. But this rapidity is misleading because more work will be required later to clean up the old tuples. That’s the vacuum process.

Another consequence with this approach is the high volume of WAL (redo log) generation because many blocks are touched when a tuple is moved to another place.

Full page logging in Postgres and Oracle - Blog dbi services

Oracle block versioning

Oracle avoids moving rows at all price because updating all indexes is often not scalable. Even when a row has to migrate to another block, Oracle keeps a pointer (chained rows) so that the index entries are still valid. That’s only when the row size increases and doesn’t fit anymore in the block. Instead of Copy-on-Write, the current version of the rows is updated in-place and the UNDO stores, in a different place, the change vectors that can be used to re-build a previous version of the block.

The big advantage here is that there’s no additional work needed to keep predictable performance on queries. The table blocks are clean and the undo blocks will just be reused later.

But there’s more. The index blocks are also versioned in the same way, which means that a query can still do a true Index Only scan even when there are concurrent changes. Oracle is versioning the whole blocks, all datafile blocks, and a query just builds the consistent version of the blocks when reading them from the buffer cache. The blocks, table or index ones, reference all the transactions that made changes in the ITL (Interested Transaction List) so that the query can know which ones are committed or not. This still takes minimum space: no bloat.

No-Bloat demo (Oracle)

Here is a small demo to show this no-bloat beauty. The code and the results explained is after the screenshot.

I create a table with a number and a timestamp, initialized with the value “1”

14:23:13 SQL> create table DEMO 
as select 1 num, current_timestamp time from dual;
Table created.

I start a transaction in SERIALIZABLE (which actually means SNAPSHOT) isolation level:

14:23:13 SQL> connect demo/demo@//localhost/PDB1
Connected.
14:23:13 SQL> set transaction isolation level serializable;
Transaction succeeded.
Elapsed: 00:00:00.001

I insert one row with value “-1”.

14:23:13 SQL> insert into DEMO values(-1,current_timestamp);
1 row created.
Elapsed: 00:00:00.003

Please remember that I do not commit this change. I am still in the serializable transaction.

Now, on other transactions, I’ll increase the value 1 million times. Because in Oracle we have autonomous transactions, I do it from there but you can do it from another session as well.

14:23:13 SQL> declare
2 pragma autonomous_transaction;
3 begin
4 for i in 1..1e6 loop
5 update DEMO set num=num+1, time=current_timestamp;
6 commit;
7 end loop;
8 end;
9 /
PL/SQL procedure successfully completed.
Elapsed: 00:01:51.636

This takes about 2 minutes. As I explained earlier, for each change the previous value is stored in the UNDO, and the status of the transaction is updated to set it to committed.

Now, I’m back in my serializable transaction where I still have the value “-1” uncommitted, and the value “1” committed before. Those are the two values that I expect to see: all committed ones plus my own transaction changes.

14:25:05 SQL> alter session set statistics_level=all;
Session altered.
Elapsed: 00:00:00.002
14:25:05 SQL> select * from DEMO;
NUM TIME
______ ______________________________________
1 12-AUG-19 02.23.13.659424000 PM GMT
-1 12-AUG-19 02.23.13.768571000 PM GMT
Elapsed: 00:00:01.011

Perfect. One second only. The 1 million changes that were done and committed after the start of my transaction are not visible, thanks to my isolation level. I explained that Oracle has to read the UNDO to rollback the changes in a clone of the block, and check the state of the transactions referenced by the ITL in the block header. This is why I can see 1 million accesses to buffers:

14:25:06 SQL> select * from dbms_xplan.display_cursor(format=>'allstats last');
PLAN_TABLE_OUTPUT
____________________________________________________________________
SQL_ID 0m8kbvzchkytt, child number 0
-------------------------------------
select * from DEMO
Plan hash value: 4000794843
--------------------------------------------------------------
| Id | Operation | Name | Starts | A-Rows | Buffers |
--------------------------------------------------------------
| 0 | SELECT STATEMENT | | 1 | 2 | 1000K|
| 1 | TABLE ACCESS FULL| DEMO | 1 | 2 | 1000K|
--------------------------------------------------------------
Elapsed: 00:00:00.043

This is still fast because this fit in only few blocks, the same set of buffers is accessed multiple time and then stay in cache.

Now, here is the nice part. My table is still very small (8 blocks — that’s 16KB):

14:25:06 SQL> commit;
Commit complete.
Elapsed: 00:00:00.004
14:25:06 SQL> exec dbms_stats.gather_table_stats(user,'DEMO');
PL/SQL procedure successfully completed.
Elapsed: 00:00:00.034
14:25:06 SQL> select num_rows,blocks from user_tables where table_name='DEMO';
NUM_ROWS BLOCKS
___________ _________
2 8
Elapsed: 00:00:00.005
14:25:06 SQL> exit

For sure, the previous values are all stored in the UNDO and do not take any space in the table blocks. But I said that Oracle has to check all the one million ITL entries. This is how my session knows that the value “-1” was done by my session (and then visible even before commit), that the value “-1” was committed before my transaction start, and that all the other updates were committed after the start of my transaction, from another transaction.

The status is stored in the UNDO transaction table, but the ITL itself takes 24 bytes to identify the entry in the transaction table. And the ITL is stored in the block header. But you cannot fit 1 million of them in a block, right?

The magic is that you don’t need to store all of them because all those 1 million transactions were not active at the same time. When my SELECT query reads the current block, only the last ITL is required: the one for the 1000000th change. With it, my session can go to the UNDO, rebuild the previous version of the block, just before this 1000000th change. And, because the whole block is versioned, including its metadata, the last ITL is now, in this consistent read clone, related to the 999999th change. You get the idea: this ITL is sufficient to rollback the block to the 999998th change…

How to drop an index created by Oracle 19c Auto Indexing?

$
0
0

ORA-65532: cannot alter or drop automatically created indexes

Oracle 19c Automatic Indexing is not like the autonomous features that happen without your control. You can decide to enable it (if you are on a platform that allows it) or not, and in report-only or implementation mode.

But when you have enabled it to create new indexes, you are not supposed to revert its effect. What if you want to drop those indexes?

DROP INDEX

If I want to drop an index that has been created automatically (i.e with the AUTO=’YES’ in DBA_INDEXES) I get the following error:

SQL> select owner,index_name,auto,tablespace_name from dba_indexes natural where auto='YES';
OWNER              INDEX_NAME    AUTO    TABLESPACE_NAME
________ _______________________ _______ __________________
ADMIN SYS_AI_8u25mzzr6xw1v YES AITBS
ADMIN SYS_AI_gg1ctjpjv92d5 YES AITBS
ADMIN SYS_AI_26rdw45ph3hag YES AITBS
SQL> drop index ADMIN."SYS_AI_8u25mzzr6xw1v";
drop index ADMIN."SYS_AI_8u25mzzr6xw1v"
*
ERROR at line 1:
ORA-65532: cannot alter or drop automatically created indexes

ALTER INDEX

I get the same error if I try to make it invisible (so that at least it is not used by the queries) or unusable (so that it is not maintained by the DML):

SQL> alter index ADMIN."SYS_AI_8u25mzzr6xw1v" invisible;
alter index ADMIN."SYS_AI_8u25mzzr6xw1v" invisible
*
ERROR at line 1:
ORA-65532: cannot alter or drop automatically created indexes
SQL> alter index ADMIN."SYS_AI_8u25mzzr6xw1v" unusable;
alter index ADMIN."SYS_AI_8u25mzzr6xw1v" unusable
*
ERROR at line 1:
ORA-65532: cannot alter or drop automatically created indexes

IND$.PROPERTY unsupported hack

In ?/rdbms/admin/cdcore_ind.sql the definition for DBA_INDEXES defines AUTO as:

decode(bitand(i.property, 8), 8, 'YES', 'NO'),
...
from ... sys.ind$ i ...

In ?/rdbms/admin/dcore.bsq the comment for this IND$ flag is probably wrong (probably an old flag being re-used for the Auto-Index feature):

property number not null,/* immutable flags for life of the index */
/* unique : 0x01 */
/* partitioned : 0x02 */
/* reverse : 0x04 */
/* compressed : 0x08 */
/* functional : 0x10 */

The comment is wrong but the important thing is that the AUTO attribute is defined as an immutable property rather than a flag that can be mutable.

This gives me a possibility to drop an index that has been created by the Auto Index feature, but totally unsupported, undocumented and probably very dangerous. Here is the OBJECT_ID:

SQL> select owner,index_name,object_id,auto,tablespace_name from dba_indexes natural left outer join (select owner index_owner,object_name index_name,object_id from dba_objects where object_type='INDEX') where auto='YES';
OWNER           INDEX_NAME OBJECT_ID AUTO TABLESPACE_NAME
_____ ____________________ _________ ____ _______________
ADMIN SYS_AI_8u25mzzr6xw1v 73191 YES AITBS
ADMIN SYS_AI_gg1ctjpjv92d5 73192 YES AITBS
ADMIN SYS_AI_26rdw45ph3hag 73193 YES AITBS

The property 0x8 is set:

SQL> select property from sys.ind$ where obj#=73191;
PROPERTY
----------
8

I un-flag it:

SQL> show user
show user
USER is "SYS"
SQL> update sys.ind$ set property=property-8 
where bitand(property,8)=8 and obj#=73191;
1 row updated.

Not anymore flagged as AUTO:

SQL> select owner,index_name,object_id,auto,tablespace_name from dba_indexes natural left outer join (select owner index_owner,object_name index_name,object_id from dba_objects where object_type='INDEX') where index_name like 'SYS_AI%';
OWNER           INDEX_NAME OBJECT_ID AUTO TABLESPACE_NAME
_____ ____________________ _________ ____ _______________
ADMIN SYS_AI_8u25mzzr6xw1v 73191 NO AITBS
ADMIN SYS_AI_gg1ctjpjv92d5 73192 YES AITBS
ADMIN SYS_AI_26rdw45ph3hag 73193 YES AITBS

And I can now drop it:

SQL> drop index ADMIN."SYS_AI_8u25mzzr6xw1v";
Index dropped.

Again, this is totally unsupported: don’t do that!

SQL> select owner,index_name,object_id,auto,tablespace_name from dba_indexes natural left outer join (select owner index_owner,object_name index_name,object_id from dba_objects where object_type='INDEX') where index_name like 'SYS_AI%';
OWNER           INDEX_NAME OBJECT_ID AUTO TABLESPACE_NAME
_____ ____________________ _________ ____ _______________
ADMIN SYS_AI_gg1ctjpjv92d5 73192 YES AITBS
ADMIN SYS_AI_26rdw45ph3hag 73193 YES AITBS

DROP TABLESPACE

In a more supported way, I can drop all AUTO indexes by dropping the tablespace where they reside. If I plan to do that, I’ve probably defined a specific tablespace for them (rather than the default tablespace for the user):

SQL> select parameter_name,parameter_value from dba_auto_index_config order by 1;
                    PARAMETER_NAME    PARAMETER_VALUE
__________________________________ __________________
AUTO_INDEX_COMPRESSION OFF
AUTO_INDEX_DEFAULT_TABLESPACE AITBS
AUTO_INDEX_MODE IMPLEMENT
AUTO_INDEX_REPORT_RETENTION 31
AUTO_INDEX_RETENTION_FOR_AUTO 373
AUTO_INDEX_RETENTION_FOR_MANUAL
AUTO_INDEX_SCHEMA
AUTO_INDEX_SPACE_BUDGET 50

This just works to remove all indexes created there:

SQL> drop tablespace AITBS including contents;
Tablespace dropped.

MOVE and DROP

I may not want to drop all of them. What if I move one index into a new tablespace? I don’t want to actually rebuild it, unusable is ok for me:

SQL> alter index ADMIN."SYS_AI_26rdw45ph3hag" rebuild tablespace EPHEMERAL unusable;
alter index ADMIN."SYS_AI_26rdw45ph3hag" rebuild tablespace EPHEMERAL unusable
*
ERROR at line 1:
ORA-14048: a partition maintenance operation may not be combined with other operations

Well, I don’t know how to do this without rebuilding it. So let’s do this:

SQL> create tablespace EPHEMERAL nologging;
Tablespace created.
SQL> alter user admin quota unlimited on EPHEMERAL;
User altered.
SQL> alter index ADMIN."SYS_AI_26rdw45ph3hag" rebuild tablespace EPHEMERAL online;
Index altered.

This works, so not all ALTER INEX commands fail with an ORA-65532.

SQL> select owner,index_name,object_id,auto,tablespace_name from dba_indexes natural left outer join (select owner index_owner,object_name index_name,object_id from dba_objects where object_type='INDEX') where index_name like 'SYS_AI%';
OWNER           INDEX_NAME OBJECT_ID AUTO TABLESPACE_NAME
_____ ____________________ _________ ____ _______________
ADMIN SYS_AI_gg1ctjpjv92d5 73192 YES AITBS
ADMIN SYS_AI_26rdw45ph3hag 73193 YES EPHEMERAL

And I can now drop this tablespace that contains only this index:

SQL> drop tablespace EPHEMERAL including contents;
Tablespace dropped.

Goal achieved, in a supported way:

SQL> select owner,index_name,object_id,auto,tablespace_name from dba_indexes natural left outer join (select owner index_owner,object_name index_name,object_id from dba_objects where object_type='INDEX') where index_name like 'SYS_AI%';
OWNER           INDEX_NAME OBJECT_ID AUTO TABLESPACE_NAME
_____ ____________________ _________ ____ _______________
ADMIN SYS_AI_gg1ctjpjv92d5 73192 YES AITBS

“_optimizer_use_auto_indexes”=OFF

Finally, if I don’t want to use the AUTO indexes, I don’t have to drop them. There’s a parameter to disable the use of them.

Here is a query using my AUTO index:

SQL> select count(*) from admin.words where sound='H400';
COUNT(*)
___________
152
SQL> select * from dbms_xplan.display_cursor(format=>'allstats last');
PLAN_TABLE_OUTPUT
____________________________________________________________________
SQL_ID bdbr7vnx88x7z, child number 0
-------------------------------------
select count(*) from admin.words where sound='H400'
Plan hash value: 335171867
-------------------------------------------------------------------                                                                                                                 | Id  | Operation         | Name                 |A-Rows| Buffers |                                                                                                                 -------------------------------------------------------------------                                                                                                                 |   0 | SELECT STATEMENT  |                      |     1|       3 |                                                                                                                 |   1 |  SORT AGGREGATE   |                      |     1|       3 |                                                                                                                 |*  2 |   INDEX RANGE SCAN| SYS_AI_gg1ctjpjv92d5 |   152|       3 |                                                                                                                 -------------------------------------------------------------------
Predicate Information (identified by operation id):
---------------------------------------------------
2 - access("SOUND"='H400')

Now, disabling all Auto Index at my session level:

SQL> alter session set "_optimizer_use_auto_indexes"=OFF;
Session altered.
SQL> select count(*) from admin.words where sound='H400';
   COUNT(*)
___________
152
SQL> select * from dbms_xplan.display_cursor(format=>'allstats last +outline');
PLAN_TABLE_OUTPUT
____________________________________________________________________
SQL_ID bdbr7vnx88x7z, child number 1
-------------------------------------
select count(*) from admin.words where sound='H400'
Plan hash value: 1662541906
----------------------------------------------------------------                                                                                                                    | Id  | Operation          | Name  | Starts | A-Rows | Buffers |                                                                                                                    ----------------------------------------------------------------                                                                                                                    |   0 | SELECT STATEMENT   |       |      1 |      1 |    1598 |                                                                                                                    |   1 |  SORT AGGREGATE    |       |      1 |      1 |    1598 |                                                                                                                    |*  2 |   TABLE ACCESS FULL| WORDS |      1 |    152 |    1598 |                                                                                                                    ----------------------------------------------------------------
Predicate Information (identified by operation id):
---------------------------------------------------
2 - filter("SOUND"='H400')

Do you really want to drop them?

Note that if you drop them, then you probably also want to disable Auto Indexing at all or they will probably re-appear:

exec dbms_auto_index.configure('AUTO_INDEX_MODE','REPORT');

And there it is your decision to create the indexes or not.

But remember that in theory, the presence of an index should not have bad effects as the optimizer. With correct statistics, the CBO can decide to use it or not. And the Auto Indexing feature has also a way to blacklist some auto-created indexes from some queries if a regression has been encountered.

How 19c Auto Indexes are named?

$
0
0

As a SQL_ID-like base 32 hash on table owner, name, column list

The indexes created by the 19c Auto Indexing feature have a generated name like: “SYS_AI_gg1ctjpjv92d5”. I don’t like to rely on the names: there’s an AUTO column in DBA_INDEXES to flag the indexes created automatically.

But, one thing is very nice: the name is not random. The same index (i.e on same table and columns) will always have the same name. Even when dropped and re-created. Even when created in a different database. This is very nice to follow them (like quickly searching in my e-mails and find the same issue encountered in another place). Like we do with SQL_ID.

Yes, the generation of the name is similar to SQL_ID as it is the result of a 64-bit number from a hash function, displayed in base 32 with alphanumeric characters.

The hash function is SYS_OP_COMBINED_HASH applied on the table owner, table name and column list. Yes, the same function that is used by extended statistics column groups. Why not? All that is developed by the CBO team. They re-use their own functions.

So, from the previous post, I have the following indexes created by Auto Index feature:

SQL> select owner,index_name,object_id,auto from dba_indexes natural left outer join (select owner index_owner,object_name index_name,object_id from dba_objects where object_type='INDEX') where auto='YES';
OWNER              INDEX_NAME    OBJECT_ID    AUTO
________ _______________________ ____________ _______
ADMIN SYS_AI_gg1ctjpjv92d5 73,192 YES
ADMIN SYS_AI_8u25mzzr6xw1v 73,231 YES
ADMIN SYS_AI_26rdw45ph3hag 73,232 YES

Let’s take the first one.

SQL> ddl "SYS_AI_gg1ctjpjv92d5"
CREATE INDEX "ADMIN"."SYS_AI_gg1ctjpjv92d5" 
ON "ADMIN"."WORDS" ("SOUND") AUTO;

Here is the hash from table owner and name (without quotes) and column list (quoted):

SQL> select SYS_OP_COMBINED_HASH('ADMIN','WORDS','"SOUND"')
from dual;
   SYS_OP_COMBINED_HASH('ADMIN','WORDS','"SOUND"')
__________________________________________________
17835830731812932005

And I’m using Nenad Noveljic conversion to base 32 from:

Converting HASH_VALUE to SQL_ID - All-round Database Topics

gg1ctjpjv92d5 is the base 32 hash value for this table/columns definition and the Auto Index created was: SYS_AI_gg1ctjpjv92d5

If you are connected as SYS, there’s an internal function for this base32 conversion (the one from SQL Plan Directives used to store the SQL_ID of the Dynamic Sampling query since 12cR2, which caches the result of dynamic sampling in the SPD rather than using the Result Cache as in 12cR2):

SQL> select ltrim(SYS.DBMS_SPD_INTERNAL.UB8_TO_SQLID( 17835830731812932005 ),'0') from dual;
LTRIM(SYS.DBMS_SPD_INTERNAL.UB8_TO_SQLID(17835830731812932005),'0')
____________________________________________________________________
gg1ctjpjv92d5

For compound indexes, here is an example:

SQL> ddl "SYS_AI_26rdw45ph3hag"
CREATE INDEX "ADMIN"."SYS_AI_26rdw45ph3hag" 
ON "ADMIN"."WORDS" ("CAP", "LOW", "UPP") AUTO;

The hash of columns is calculated on a the space-free comma-separated quoted column list:

SQL> select SYS_OP_COMBINED_HASH
('ADMIN','WORDS','"CAP","LOW","UPP"')
from dual;
SYS_OP_COMBINED_HASH('ADMIN','WORDS','"SOUND"')
__________________________________________________
2548399815876788559
SQL> select ltrim(SYS.DBMS_SPD_INTERNAL.UB8_TO_SQLID( 2548399815876788559 ),'0') from dual;
LTRIM(SYS.DBMS_SPD_INTERNAL.UB8_TO_SQLID(2548399815876788559),'0')
____________________________________________________________________
26rdw45ph3hag

Here it is. The hash is 26rdw45ph3hag on the columns indexed by SYS_AI_26rdw45ph3hag.

Back with Nenad function, here is how to generate the AI name for any existing index:

with function TO_SQLID(n number) return varchar2 as
--https://nenadnoveljic.com/blog/converting-hash_value-to-sql_id/
base32 varchar2(16);
begin
select
listagg(substr('0123456789abcdfghjkmnpqrstuvwxyz',
mod(trunc(n/power(32,level-1)),32)+1,1)
) within group (order by level desc) into base32
from dual
connect by level <= ceil(log(32,n+1));
return base32;
end;
select table_owner,table_name,cols,'SYS_AI_'||
to_sqlid(sys_op_combined_hash(table_owner,table_name,cols))
AI_INDEX_NAME
from (
select table_owner,table_name,index_name
,listagg('"'||column_name||'"',',')
within group(order by column_position) cols
from dba_ind_columns
--where index_name like 'SYS_AI%'
group by table_owner,table_name,index_name
);

Of course, when the index is created its name and definition is accessible. But being sure that the name is a predictable hash will help to manage Automatic Indexes.

With this post and the previous one, you have all information to rename a manually created index to am Auto Index one and set the AUTO flag. Of course, don’t do that. Auto Index keeps metadata about the SQL Tuning Sets and Auto Index DDL actions and faking the AUTO flag will make all that inconsistent.

Those examples on this WORDS tables comes from the demo I’m preparing for my Oracle Open World session on Auto Index:

Oracle Database 19c Automatic Indexing Demystified
Thursday, Sept. 19th, 02:15 PM in Moscone West — Room 3020A

Also many sessions on the same topic:

Session Catalog

Oracle Connection Manager (CMAN) quick reporting script

$
0
0

Here is a script I use to parse Connection Manager “show service”

List services registered by instance

CMCTL can show the services in a long list, but I want something quick like this, with one line per service, and one column per endpoint that registers to CMAN:

script output, a bit obfuscated

The following script

  • get all CMAN running on the current host (with pgrep tnslsnr)
  • run CMCTL with the righ environment variables
  • run “administer” and “show services”
  • parse the output with AWK to put instances into columns
  • resolves IP addresses by colling “host” and removes the domain name
ps --no-headers -o pid,args -p$(pgrep -f "tnslsnr .* -mode proxy") |
while IFS=" " read pid tnslsnr args
do
# get environment variables
awk '
BEGIN{RS="\0"}
/^ORACLE_HOME|^TNS_ADMIN|^LD_LIBRARY_PATH/{printf "%s ",$0}
END{print cmctl,here}
' cmctl="$(dirname $tnslsnr)/cmctl" here="<<-'CMCTL'" /proc/$pid/environ
# name is probably the first arg without '-' nor '='
name=$(echo "$args"|awk 'BEGIN{RS=" "}/^[^-][^=]*$/{print;exit}')
echo "administer $name"
echo "show services"
echo "CMCTL"
done | sh | awk '
/Service ".*" has .* instance/{
gsub(qq," ")
sub(/[.].*/,"") # remove domain
service=$2
all_service[service]=1
stats="-"
}
/Instance ".*", status READY, has .* handler.* for this service/{
gsub(qq," ")
instance=$2
all_instance[instance]=0
stats="-"
}
/established:.* refused:.* state:.*/{
sub(/^ */,"")
sub(/.DEDICATED./,"D")
sub(/established:/,"")
sub(/refused:/,"/")
sub(/state:/,"")
sub(/ready/,"R")
stats=$0
}
/ADDRESS.*HOST=.*PORT=/{
port=$0;sub(/.*PORT=/,"",port);sub(/[)].*/,"",port)
host=$0;sub(/.*HOST=/,"",host);sub(/[)].*/,"",host)
if (host ~ /^[0-9.]+$/) {
"host "host| getline host_host
sub(/^.* /,"",host_host)
sub(/[.]$/,"",host_host)
host=host_host
}
sub(/[.].*/,"",host) # remove domain
all_instance_host[instance]=host
all_instance_port[instance]=port
all_instance_instance[instance]=instance
all_instance_stats[instance]=stats
all_service_instance[service,instance]=instance
if (length(host) > all_instance[instance] ) {
all_instance[instance]= length(host)
}
if (length(port) > all_instance[instance] ) {
all_instance[instance]= length(port)
}
if (length(instance) > all_instance[instance] ) {
all_instance[instance]= length(instance)
}
}
END{
# host
printf "1%39s ","host:"
for (instance in all_instance){
printf "%-"all_instance[instance]"s ", all_instance_host[instance]
}
printf "\n"
# port
printf "2%39s ","port:"
for (instance in all_instance){
printf "%-"all_instance[instance]"s ", all_instance_port[instance]
}
printf "\n"
# instance
printf "3%39s ","instance:"
for (instance in all_instance){
printf "%-"all_instance[instance]"s ", all_instance_instance[instance]
}
printf "\n"
# stats
printf "4%39s ","established/refused:"
for (instance in all_instance){
printf "%-"all_instance[instance]"s ", all_instance_stats[instance]
}
printf "\n"
# header
printf "5%39s ","---------------------------------------"
for (instance in all_instance){
printf "%-"all_instance[instance]"s ", substr("----------------------------------------",1,all_instance[instance])
}
printf "\n"
# services
for (service in all_service){
printf "%-40s ",service
for (instance in all_instance){
if (all_service_instance[service,instance]!="") {
printf "%-"all_instance[instance]"s ", all_service_instance[service,instance]
} else {
printf "%-"all_instance[instance]"s ", ""
}
}
printf "\n"
}
}' qq='"'| sort

Of course, it may be improved, and probably there are better solutions already existing. This was just faster for me rather than looking for an existing solution. Feedbacks on twitter, please:

pgbench retry for repeatable read transactions — first (re)tries

$
0
0

pgbench retry for repeatable read transactions — first (re)tries

Trying a no-patch solution for pgbench running on repeatable read transactions, using a custom script with PL/pgSQL

In a previous post I was running pgBench on YugaByteDB in serializable isolation level. But Serializable is optimistic and requires that the transactions are re-tried when failed. But pgBench has no retry mode. There was a patch proposed in several commit fests for that, but patch acceptance is a long journey in PostgreSQL:

WIP: Pgbench Errors and serialization/deadlock retries

Rather than patching pgbench.c I’m trying to implement a retry logic with the preferred procedural code: plpgsql. This is not easy because there are many limits with transaction management in procedures. So let’s start simple with a Repetable Read isolation level and trying to get most of the threads not failing before the end.

pgBench simple-update builtin

I create a database for my demo with Repeatable Read default isolation level, and initialize the pgBench schema:

## restart the server
pg_ctl -l $PGDATA/logfile restart
## create the database and the procedure
psql -e <<'PSQL'
-- re-create the demo database and set serializable as default
drop database if exists franck;
create database franck;
alter database franck set default_transaction_isolation='repeatable read';
PSQL
pgbench --initialize --init-steps=dtgvpf franck
alter database set default_transaction_isolation=’repeatable read’;
\! pgbench — initialize — init-steps=dtgvpf

Then I run the built-in simple update, from 10 threads:

pgbench --builtin=simple-update --time 30 --jobs=10 --client=10 franck

Here is the disappointing result:

My clients fail quickly as soon as they encounter a serialization error and all finishes with few threads only. Those errors are normal in a MVCC database. Maximum concurrency is achieved with optimistic locking. It is up to the application to re-try when encountering a serialization error.

But pgBench has no option for that. To workaround this I create a procedure that does the same job as the simple-update builtin, so that I have a procedural language (PL/pgSQL) to do those retries.

pgBench simple-update script

Here is what is actually harcoded for the simple-update builtin:

cat > /tmp/simple-update.sql <<'CAT'
-- simple-update <builtin: simple update>
\set aid random(1, 100000 * :scale)
\set bid random(1, 1 * :scale)
\set tid random(1, 10 * :scale)
\set delta random(-5000, 5000)
BEGIN;
UPDATE pgbench_accounts SET abalance = abalance + :delta
WHERE aid = :aid;
SELECT abalance FROM pgbench_accounts WHERE aid = :aid;
INSERT INTO pgbench_history (tid, bid, aid, delta, mtime)
VALUES (:tid, :bid, :aid, :delta, CURRENT_TIMESTAMP);
END;
CAT

I can run it with:

pgbench --file=/tmp/simple-update.sql --time 30 --jobs=10 --client=10 franck

Of course, the result is the same as with the built-in: threads die as soon as they encounter a serialization error.

pgBench simple-update anonymous block

My first idea was to run an anonymous block in order to add some procedural code for retries:

cat > /tmp/simple-update.sql <<'CAT'
-- simple-update <builtin: simple update>
\set aid random(1, 100000 * :scale)
\set bid random(1, 1 * :scale)
\set tid random(1, 10 * :scale)
\set delta random(-5000, 5000)
DO
$$
BEGIN;
UPDATE pgbench_accounts SET abalance = abalance + :delta
WHERE aid = :aid;
SELECT abalance FROM pgbench_accounts WHERE aid = :aid;
INSERT INTO pgbench_history (tid, bid, aid, delta, mtime)
VALUES (:tid, :bid, :aid, :delta, CURRENT_TIMESTAMP);
END;
$$
CAT

but this is not possible because bind variables are not possible in anonymous blocks:

ERROR: bind message supplies 7 parameters, but prepared statement “” requires 0

pgBench simple-update procedure

Then I create a stored procedure for that procedural code.

Here is the call:

cat > /tmp/simple-update.sql <<'CAT'
-- simple-update <builtin: simple update>
\set aid random(1, 100000 * :scale)
\set bid random(1, 1 * :scale)
\set tid random(1, 10 * :scale)
\set delta random(-5000, 5000)
call SIMPLE_UPDATE_RETRY(:aid, :bid, :tid, :delta);
SELECT abalance FROM pgbench_accounts WHERE aid = :aid;
CAT

I keep the SELECT in the client as I cannot return a resultset from a procedure.

The UPDATE and INSERT are run into the procedure:

psql -e <<'PSQL'
\connect franck
create or replace procedure SIMPLE_UPDATE_RETRY
(p_aid integer, p_bid integer, p_tid integer, p_delta integer) AS $$
BEGIN
UPDATE pgbench_accounts SET abalance = abalance + p_delta
WHERE aid = p_aid;
INSERT INTO pgbench_history (tid, bid, aid, delta, mtime)
VALUES (p_tid, p_bid, p_aid, p_delta, CURRENT_TIMESTAMP);
END;
$$ language plpgsql;
PSQL

Of course, I’ll get the same error as there’s no retry logic yet:

pgbench --file=/tmp/simple-update.sql --time 30 --jobs=10 --client=10 franck
ERROR: could not serialize access due to concurrent update

pgBench simple-update procedure with retry

Now that I have a procedure I can add the retry logic:

  • a loop to be able to retry
  • in the loop, a block with exception
  • when no error is encountered, exit the loop
  • when error is encountered, rollback and continue the loop
  • in case there are too many retries, finally raise the error
psql -e <<'PSQL'
\connect franck
create or replace procedure SIMPLE_UPDATE_RETRY
(p_aid integer, p_bid integer, p_tid integer, p_delta integer) AS $$
declare
retries integer:=0;
BEGIN
loop
begin
UPDATE pgbench_accounts SET abalance = abalance + p_delta
WHERE aid = p_aid;
INSERT INTO pgbench_history (tid, bid, aid, delta, mtime)
VALUES (p_tid, p_bid, p_aid, p_delta, CURRENT_TIMESTAMP);
-- exits the loop as we got no error after all DML
exit;
exception
when serialization_failure then
-- need to rollback to run in a new snapshot
rollback;
-- give up after 10 retries
if retries >10 then
raise notice 'Give Up after % retries. tid=%',retries,p_tid;
raise;
end if;
-- continue the retry loop
end;
retries=retries+1;
end loop;
commit;
if retries > 2 then
raise notice 'Required % retries (tid=%)',retries,p_tid;
end if;
END;
$$ language plpgsql;
PSQL

Note that the “rollback” is required. The exception block does a rollback to savepoint, but then it continues to run in the same snapshot. Without starting another transaction the same serialization error will be encountered.

Here is one run without any serialization error:

However, with less luck I can encounter this:

The serialization errors now occur on COMMIT. That’s another big surprise when coming from Oracle. Oracle has weakest isolation levels, but the goal is to avoid errors at commit, which is critical for OLTP and even more with distributed transactions. With PostgreSQL, the commit can raise an error. But unfortunately, my PL/pgSQL procedure cannot prevent that because I cannot commit within an exception block. That’s another limitation of transaction control in procedures.

protocol=prepared

I used the default “simple” protocol here. Obviously, I want to use “prepared” because I don’t want to parse each execute: my benchmark goal is to measure execution rate, not parsing. But running what I have here (call to procedure with a rollback in the exception handler) crashes with prepared statement:

And with PostgreSQL it seems that when a client crashes, many others fear a memory corruption and prefer to abort. I even got some case where instance recovery was required. That’s annoying and not easy to troubleshoot. The core dump says segmentation fault on pquery.c:1241 when reading pstmt->utilityStmt.

In summary… small solutions and big questions

The retry logic is mandatory when benchmarking on repeatable read or serializable isolation level. Pgbench is there to do benchmarks for PostgreSQL flavors. I want to also use it to benchmark other databases with postgres-compatible APIs, like CockroachDB or YugaByteDB. Those databases require a serializable isolation level, at least for some features. But I faced many limitations:

  • I cannot use anonymous blocks with bind variables ➛ stored procedure
  • I cannot return the select result from a stored procedure (and cannot do transaction management in functions) ➛ SELECT is done out of the transaction
  • cannot commit in exception blocks ➛ remains the possibility of non-retried error

If you have any remark about this, please tell me (Twitter: @FranckPachot). Of course I’ll investigate further on the core dump and other possibilities. In my opinion, those retries must be done in the server and not in a client loop. It makes no sense to add additional round-trips and context switches for this. Pgbench is there to do TPC-B-like benchmarks where each transaction should be at most one call to the database.

An Oracle Auto Index function to drop secondary indexes - what is a “secondary” index?

$
0
0

dbms_auto_index.drop_secondary_indexes

In 19.4 the Auto Index package has 4 procedure/functions:

  • CONFIGURE to set the Auto Index documented parameters
  • REPORT_ACTIVITY to get a CLOB about an Auto Index executions (statements analyzed, indexes created,…)
  • REPORT_LAST_ACTIVITY which calls the previous one for the last run only
  • DROP_SECONDARY_INDEX which is documented as “Deletes all the indexes, except the ones used for constraints, from a schema or a table.

What is a secondary index?

I have not used this term for a long time. First, I’ve learned it at school during my first databases classes. The course supposed that the table rows are stored ordered, on the primary key. Then, the index on the primary key is a bit special: it does not need to have an entry for each row. It can be “sparse”. A value between the two index entries will be physically between the two locations. This index on the primary key is the “primary” index. And of course, it is unique. The other indexes are called “secondary” and must be dense, with one entry for each row to address (scattered physically in the table) and can be unique or not.

Then I started to work on Oracle and forgot about all that: there’s no distinction between a “primary” and a “secondary” index. And there’s no need to create a “primary” one first. We can create many indexes, and later decide what will be the primary key. One of the indexes may be used to enforce the constraint if it starts with those columns, not even needed to be unique.

All indexes are “dense” with Oracle because there’s no physical order in a Heap Table. We can get an idea about “sparse” index when we think about the branches: they store only a min/max value for each leaf block. But they address a leaf block and not table blocks with full rows. Except when the leaves contain the full rows and there’s no additional Heap Table. This is the case with an Index Organized Table (IOT). The “sparse” branches and “dense” leaves are not the only analogy between Oracle IOT and the “primary” indexes. An IOT can be created only the primary key. It is a primary index. And the other indexes are secondary indexes: “dense”, addressing the IOT leaf blocks through its primary index.

There are other databases where the tables are clustered, must have a primary key defined at table creation time, enforced by the primary index. But with Oracle, and all databases with heap tables, are different. Oracle does not constrain indexes to be primary or secondary, index definition is not dependent on physical storage. This is agility invented 40 years ago.

dbms_auto_index.drop_secondary_indexes

In the context of Auto Indexing, “secondary” indexes have a slightly different meaning. Of course, the index enforcing the primary key is not considered as “secondary”. But the idea of “secondary” goes further: all indexes that are not required by integrity constraints. This is the idea which started on Exadata where analytic workloads may not need indexes thanks to SmartScan. It continued with the Autonomous DataWarehouse cloud service, where the CREATE INDEX was not available — allowing only implicit indexes created by primary key or unique constraint. Now it goes to OLTP where indexes do not need to be created but the optimizer will create them automatically.

Here we can imagine that this Auto Index function is there to drop all the indexes created for performance reasons, so that the Auto Index feature can create the required ones only. But what about the indexes created on foreign key columns to avoid a table lock when the parent key is deleted? We don’t want to drop then, right? It is a secondary index, but can it be considered as “used for constraints” even if it is not referenced in the dictionary by DBA_CONSTRAINTS.INDEX_NAME?

I’ve created a few additional indexes on the SCOTT schema:

connect scott/tiger@//localhost/PDB1
create index EMP_HIREDATE on EMP(HIREDATE);
create index EMP_FK on EMP(DEPTNO);
create bitmap index EMP_BITMAP on EMP(JOB);
create index EMP_FKPLUS on EMP(DEPTNO,JOB);
create unique index EMP_UNIQUE on EMP(HIREDATE,ENAME);
set ddl segment_attributes off
set ddl storage off
select dbms_metadata.get_ddl('INDEX',index_name,user) from user_indexes;

Here I have unique and non-unique, regular and bitmap, covering foreign key only, or foreign key plus other columns:

I run the “drop secondary index” procedure:

exec sys.dbms_auto_index.drop_secondary_indexes('SCOTT','EMP');

Here is what remains:

  • All unique indexes are still there, not only the ones on the primary key
  • the index that covers exactly the foreign key remains
  • all other have been dropped

But the index that covers more than the foreign key (EMP_FKPLUS) has been dropped. And don’t think that there’s some intelligence that detected the other index on the foreign key (EMP_FK). If you run the same without EMP_FK, the EMP_FKPLUS is still dropped. So be careful if you use this: an index which was created to avoid lock will be considered “secondary” except if it was created with exactly the foreign key columns. I have sql_trace’d the query used to find the indexes to drop:

Look at the LISTAGG: the comparison between the foreign key columns and the index column is too simple in my opinion: exactly the same columns and in the same position. The index to solve a “foreign key lock issue” can be more complex: it only needs to start with the foreign key columns, in whatever order.

In summary, what is considered as dropping “secondary” indexes here is basically dropping all non-unique indexes, not enforcing unique constraints, and not matching exactly the foreign key columns. This Drop Secondary Indexes procedure is probably there only for testing: removing all indexes that may be created automatically and see what happens.

Truncate AWR tables (unsupported)

$
0
0

When WRH$ tables grow too large so that they cannot be purged

This is no supported, please look at the My Oracle Support notes for a supported way to purge AWR when going too big, like re-creating AWR (needs to start the database in restricted mode) or purging with the normal procedure (can be long as it runs a delete). And do not copy-paste my statements as this is just an example.

When some tables grow too large, the purge job does not work correctly (because some things like the partitioning are done at the end). Then SYSAUX grows. And worse: the next upgrade may take hours if it has to change something on the AWR tables.

Upgrade time

Here is an example of an upgrade from 11g to 19c which took hours. Here is how I open the upgrade logs with “less” for the Top-10 longest statement execution:

eval $( grep -n "^Elapsed:" catupgrd*.log | sort -rk2 | awk -F: 'NR<10{print "less +"$2" "$1";"}' )

Or this one to display them in order:

tac catupgrd*.log | awk '/^Elapsed:/{print x;x="";e=$2}e>"00:01:00"{x=e" "NR" "$0"\n"x}' | sort -r | more

Many hours were spend on updating AWR tables like a new index on WRH$_EVENT_HISTOGRAM, add a column on WRH$_SQLSTAT to count obsoletes, add In-memory columns in WRH$_SEG_STAT, and many new indexes. If AWR became too large, you should do something before the upgrade. For system.logmnrc_gtlo that will probably be another blog post.

Check AWR size

Here is how to check the size of AWR before the upgrade:

sqlplus / as sysdba @ ?/rdbms/admin/awrinfo

If the query never returns, then maybe it is too large…

Baselines

First I check that I didn’t explicitly create AWR baseline to keep old snapshots:

select * from dba_hist_baseline where baseline_type<>'MOVING_WINDOW';

If there are some, then what I’ll do will lose son information someone wanted to retain, so check before.

Create new partitions

For the partitioned ones, I can force the creation of a new partition so that I can, later, truncate only the old ones without losing the recent AWR snapshots:

alter session set "_swrf_test_action" = 72;

This is the workaround when the partitions were not created automatically.

Truncate all old partitions

After a while (run a few dbms_workload.create_snapshot) I truncate those old partitions. Here is how I generate the drop statement:

select 'alter table '||object_name||' truncate partition '||subobject_name||' update global indexes;'
from dba_objects where object_name like 'WRH$%' and object_type = 'TABLE PARTITION' and created>sysdate-1
;

I mention CREATED>SYSDATE-1 because I don’t want to truncate those that I have just split today, in order to keep some basic recent statistics just in case.

But now remains a few big tables that cannot be partitioned.

Look at large tables in SYS for WRH$

If I am not sure about the statistics gathering, I run it explicitly in order to see the recent number of rows (but this can take long):

exec DBMS_STATS.GATHER_DICTIONARY_STATS;

I’m interested in those larger than 1 million rows. For the ones that are partitioned, I have truncated large partitions only. But for the non-partitioned ones, I’ll truncate the whole table — and then lose everything.

select owner,table_name,dbms_xplan.format_number(num_rows) num_rows,object_type,partition_name,(select count(*) from dba_tab_partitions p where s.owner=p.table_owner and s.table_name=p.table_name) part from dba_tab_statistics s where owner in ('SYS','SYSTEM') and table_name like 'WRH$%' and num_rows>1e6 order by s.num_rows;

Here is the result. Use the same query without the ‘WRH$’ pattern in order to see everything that may cause problems at upgrade time.

The column PART is the number of partitions. Those with 0 are not partitioned and then the truncate will remove all data.

Truncate large non-partitioned ones

Some tables are not partitioned and I truncate the largest ones (which I’ve identified from the query above). I prefer to limit them because:

  • Fresh snapshot information will be lost
  • Inconsistency (snapshots with no data)
-- this is my example, you may have different tables
--
truncate table WRH$_TABLESPACE_SPACE_USAGE update global indexes;
truncate table WRH$_EVENT_HISTOGRAM update global indexes;
truncate table WRH$_MUTEX_SLEEP update global indexes;
truncate table WRH$_ENQUEUE_STAT update global indexes;
truncate table WRH$_SYSMETRIC_SUMMARY update global indexes;
truncate table WRH$_BG_EVENT_SUMMARY update global indexes;
truncate table WRH$_SYSMETRIC_HISTORY update global indexes;
truncate table WRH$_SQL_BIND_METADATA update global indexes;
truncate table WRH$_SQL_PLAN update global indexes;

This is fast, but if you need to run this, better do it when there’s no snapshot gathering. And do not rely on my list: chose the largest ones you have.

Note that truncating WRH$_SQL_PLAN will remove all old SQL Plans. I usually rarely need to look at an old plan (better to tune the current one rather than looking at the past) but they may help sometimes to get the plan, with its outlines, that worked before. So, do not do that when you have performance instabilities. Or ensure that you have a SQL Tuning Set containing the critical queries.

Use regular purge

Now I want everything to be consistent. I determine the earliest snapshot I have that is fully consistent (gathered after my truncate table statements):

select dbid,min(snap_id) from WRH$_SQL_PLAN group by dbid;

I choose this table because it was the last one I truncated.

Then I run the supported purge procedure for those snapshots:

exec DBMS_WORKLOAD_REPOSITORY.DROP_SNAPSHOT_RANGE(0,177189,28047622);

This brings me back to a consistent set of data. And this should not take long because but I ensured that there is no more than one million rows in each table.

I split again to start clean:

alter session set "_swrf_test_action" = 72;

Maybe reduce the retention

As I had AWR growing too much, I reduced the retention:

exec DBMS_WORKLOAD_REPOSITORY.MODIFY_BASELINE_WINDOW_SIZE(8);
exec DBMS_WORKLOAD_REPOSITORY.MODIFY_SNAPSHOT_SETTINGS(retention=>8*60*24);

I changed the baseline duration as it cannot be larger than the retention.

If you need larger retention, then maybe you should set up a Centralized AWR Warehouse.


19c High-Frequency statistics gathering and Real-Time Statistics

$
0
0

Those are the two exciting new features about the optimizer statistics which arrived in the latest release of 12cR2: 19c. Less exciting is that we are not allowed to use them in any other platform than Exadata:

https://apex.oracle.com/database-features/

But let’s cross the fingers and hope that this will be released in the future because they solve real-life problems such as Out-of-Range queries. Here is a little example involving both of them. A table starts empty and is growing during the day. Relying only on the statistics gathered during the maintenance window will give bad estimations. And dynamic sampling may not sample the right blocks.

A little example

Here is a little example where I insert one row every second in a DEMO table and look at the statistics.

Initialization

First I initialize the example by creating the table, gathering stats on it and set the global parameter AUTO_TASK_STATUS to ON. In is not obvious from the name, but in the context of DBMS_STATS, this Auto Task is the “high-frequency” one, running outside of the maintenance window, every 15 minutes by default, as opposed to the Auto Job that runs during the maintenance window every 4 hours.

spool hi-freq-stat.log
set echo on time on
whenever sqlerror exit failure
alter session set nls_date_format='dd-MON-yyyy hh24:mi:ss';
create table DEMO(d date,n number(*,2),h varchar2(2),m varchar2(2));
exec dbms_stats.gather_table_stats(user,'DEMO');
show parameter exadata
exec dbms_stats.set_global_prefs('auto_task_status','on');

This is a lab where I simulate Exadata features. High-Frequency Automatic Optimizer Statistics Collection is available only on Exadata.

Run every second

Every second I run this transaction to add one row. The D column will contain SYSDATE at the time of insert:

insert into DEMO (D, N, H, M) values (sysdate
,sysdate-trunc(sysdate,'HH24')
,to_char(sysdate,'HH24')
,to_char(sysdate,'MI'));
select count(*),min(d),max(d) from DEMO;
commit;

Then I query the column statistics for this D column:

exec dbms_stats.flush_database_monitoring_info;
with function d(r raw) return date as o date;
begin dbms_stats.convert_raw_value(r,o); return o; end;
select column_name,d(low_value),d(high_value),num_distinct,notes
from dba_tab_col_statistics where owner=user and table_name='DEMO'
and column_name='D'
/

As an example, here is the 10000th iteration 2 hours 46 minutes after the initialization:

The min value is from 20:22:16 and the max value is this insert at 23:18:19

Without those 19c features, the statistics would have stayed at 0 distinct values, and null low/high, as it was gathered when the table was empty.

However, here I have two statistics here (visible in the dictionary after flushing database monitoring info):

  • Real-Time Statistics (NOTES=STATS_ON_CONVENTIONAL_DML) which is updated when DML occurs and can be used as dynamic statistics without the need to sample. The number of distinct value is not known there (this is not updated on the fly because it would be expensive to know if new values are within the same set of existing values, or not). high/low values are accurate: in this example less than 2 minutes stale (23:16:42 is the high value known at 23:19:18 point-in-time).
  • The regular Statistics (no NOTES) which are not as accurate, but not too stale either: nearly 15 minutes stale (23:02:06 is the high value known at 23:19:18 point-in-time). And they are full statistics (gathered on the table with Auto Sample size): the number of distinct values is the one we had at 23:02:06 when the statistics were gathered by the “high-frequency” task.

Cleanup

To cleanup the test I drop the table and set back the auto_task_status to the default (off):

set termout off
drop table DEMO;
set termout on
exec dbms_stats.set_global_prefs('auto_task_status','off');

High-Frequency statistics gathering task result

I have run this every second for 10 hours with:

for i in {1..36000} ; do echo @ /tmp/sql2.sql ; done

And I awk’d the spool to get information about the distinct statistics we had during that time (regular statistics only) and the first time they were known:

awk '
#ignore real-time stats here
/STATS_ON_CONVENTIONAL_DML/{next}
#store update time
/> commit;/{time=$1}
# stats on column inserted with SYSDATE
/^D/{if (logtime[$0]==""){logtime[$0]=time}}
END{for (i in logtime){print i,logtime[i]}}
' hi-freq-stat.log | sort -u

As the high value is the SYSDATE at the time of insert, this shows the staleness:

Here, I started my script at 20:22:16 with an empty table, and gathered the statistics, then showing 0 rows and null low/high value. Then one row was inserted each second. And the statistics stay until 20:31:30 where they show 523 lines. The high value here is from 20:31:29 when the high-frequency job has run. Those stats were used by the optimizer until 20:46:38 when the task has run again.

All those task and job execution are logged and visible from the same view:

select * from DBA_AUTO_STAT_EXECUTIONS order by OPID;

The detail for this specific tables from DBA_OPTSTAT_OPERATION_TASKS:

select target,start_time,end_time,notes 
from DBA_OPTSTAT_OPERATION_TASKS
where target like '%DEMO%' order by OPID desc

We see the runs every 15 minutes from 20:22:16, then 20:31:30, then 20:46:38… until 23:02:06

Then, I was till inserting at the same rate but the task, still running every 15 minutes, gathered statistics on this table only every 30 minutes: 23:02:06, then 23:32:12… and we see the latest here every 60 minutes only.

What do you think happened for the high-frequency job not gathering statistics on this table 15 minutes after the 23:02:06 run?

Let’s look at the numbers:

  • I insert one row per second
  • The task runs every 15 minutes

This means that when the task runs, I have inserted 900 rows. I didn’t change the default STALE_PERCENT which is 10%. And when those 900 rows do reach the threshold of 10%? When the table has more than 9000 rows.

And now look at the log at 23:02:06 before the task has run:

The statistics show 8222 rows (from DBA_TAB_STATISTICS but as I know they are all unique I guess them from the NUM_DISTINCT in DBA_TAB_COL_STATISTICS) and then the 900 modifications recorded count for 11%. This is higher than 10%, the table statistics are stale and the next task has re-gathered them:

A side note: the “STATS_ON_CONVENTIONAL_DML” disappeared because statistics were just gathered. But that’s for later…

Now that the table is known to have 9078 rows, when will it be stale again? 15 minutes later we will have inserted 900 rows, but 900/9078=9.9% and that’s under the 10% threshold. This is why the next run of the task did not gather statistics again. But after another 15 minutes, then 1800 rows have been inserted and that’s a 19.8% staleness.

You see the picture: this high-frequency task takes care of the very volatile tables. It runs every 15 minutes (the default AUTO_TASK_INTERVAL) and spends no more than 1 hour (the default AUTO_TASK_MAX_RUN_TIME).

Real-Time statistics

And to go further, Real-Time statistics not only count the modifications to evaluate the staleness but also stores information about low and high value.

Here is my awk script now showing the distinct information from the real-time statistics:

awk '
#ignore real-time stats here
#store update time
/> commit;/{time=$1}
# stats on column inserted with SYSDATE
/^D.*STATS_ON_CONVENTIONAL_DML/{if (logtime[$0]==""){logtime[$0]=time}}
END{for (i in logtime){print i,logtime[i]}}
' hi-freq-stat.log | sort -u

and an except around the time where the high-frequency job ran every 15 or 30 minutes only:

While I was inserting every second, the staleness is 2 minutes only. This reduces even further the risk of out-of-range queries.

Basically, the high-frequency task:

  • gathers statistics in the same way as in the maintenance window job (stale tables first) but more frequently and using fewer resources

and real-time statistics:

  • adds some more fresh information, not from gathering on the table but inferring from the DML that was monitored.

A little remark though: there’s no magic to have the new query executions use the new statistics. The high-frequency task just calls dbms_stats with the default rolling window invalidation.

The Oracle Cloud Free Tier

$
0
0

The New “Always Free Service”s announced at OOW19

Every software vendor has also some free offers, to attract users, demonstrate their product, and support advocacy. What is free at Oracle? Today, the target is about the products which help to attract developers. We have the Oracle XE database that can be installed everywhere for free, with some limits on the capacity, but mostly every features. There are the developer tools that ease the use of the database, like SQL Developer. But what about Cloud?

Cloud free trials and promotions

You may have tested the 30-days free trial, and find it not so easy as it is for only one month, with an e-mail address, phone number, and credit card information that you cannot reuse. The limit on credit is not a problem as they are burned slowlier than in paid subscription (good to test many features, not good to evaluate the real price). As an ACE Director, I have access to longer trials. Actually, those trials are just promotions: you subscribe like for a paid account but are not be charged.

view-source:https://myservices.us.oraclecloud.com/mycloud/signup?language=en&sourceType=:ow:o:p:feb:0916FreePageBannerButton&intcmp=:ow:o:p:feb:0916FreePageBannerButton

As far as I know, there are 5 types of promotions.

  • “Free Trial” : $300 / 30 days
  • “Developer” : $500 / 30 days
  • “Student” : $5000 / 365 days
  • “Startup” : $100000 / 365 days
  • “Educator” : $25000 / 365 days

Where did I get this information from? It is just a guess when looking at the trial sign-up form source code which contains a JavaScript “promoMap”

Where did I get to this sign-up page? I just clicked on “Start for free” in the new Oracle Cloud Free Tier that was just announced by Larry Elison at Oracle Open World 2019. And that’s the purpose of this blog post.

The 30-days “Free Trial” is the one available from the Oracle website (the annoying pop-up that you get even when reading Oracle blogs). The “Developer” one can be available for Hands-On Labs. The “Student” is for Oracle University customers, the “Educator” is for the Oracle University instructors. The “Student” is also the one we can get through the ACED program. The “Startup” one has higher limits (like 20 OCPU instead of 6 in the other promotions)

Oracle Cloud Free Tier

Here it is, an extension of the current free trial (300$ on mostly all services, up to 8 instances and 5TB, for 30 days) where, in addition to this free trial, some services are offered free for un unlimited time.

https://www.oracle.com/cloud/free/

Oracle Cloud Free Tier

It is an extension. You still need to create a trial account (with a new e-mail, phone number, credit card) but beyond the trial you will continue to have access to some free service, forever.

What is free?

The unlimited free tier lets you create at most 2 database services and 2 compute services.

2 database services

Those are the common autonomous services: ATP serverless (for OLTP) and ADW (for datawarehouse). They come with many tools for administration, development and reporting: APEX (low code rapid application development), SQL Developer (Web version), Zepplin notebooks (through Oracle Machine Learning),…

Each database service is limited to 1 OCPU and can go up to 20 GB.

2 compute services

Each VM is limited to 1/8th of OCPU and 1 GB RAM.

It includes the Block storage (100GB) for 2 volumes (to be associated to the 2 VMs), Object Storage (10GB), Archive storage (10GB), and one load balancer (10 Mbps).

How free and unlimited?

First, you must sign-up for the 30-days trial, where you have to provide credit card information.

But you will not be billed.

What you do with the 30-days trial can be upgraded later to a paid subscription. Or not, and you still keep the free tier.

You need to provide a unique e-mail, phone, and credit card. You need to access the free service at least every 3 months or it can be removed. Note that nothing prevents you to run production on it (except the limits of course).

More info on the “Always Free Cloud Services” in the Universal Credits document:

Here is what I get after the subscription:

OGB Appreciation Day : “_query_on_physical” (again)

$
0
0

OGB Appreciation Day : “_query_on_physical” (again)

Looks like we are on the #ThanksOGB day.

One place where the Oracle Community is great is when it helps users with the technology, far from the commercial considerations. We all know that it can be very easy to use some features that are not covered by the license we bought, and this can cost a lot in case of an LMS audit. Here is a post about trying to avoid to activate Active Data Guard option by mistake, as there were many attempts to find a solution in the community.

Originally, Data Guard was a passive standby, to reduce RTO and RPO in case of Disaster Recovery. We were able to open it for queries, but then it was not syncing anymore. Then came many features that allow doing a lot more on the standby. But those were subject to an additional cost option called Active Data Guard. One of the major features is the ability to continue the APPLY while the standby is opened READ-ONLY: executing real-time queries, still in fully ACID consistent mode. And because the developers do not think about those who do not have the option, and the sales do not really care about this, the default when doing a “startup” on a standby database was to OPEN it READ ONLY. Then here is what happens: the broker starts the log APPLY and the database is flagged (in the primary) as using Active Data Guard.

So, the Oracle community came with some ideas to prevent this. Unfortunately mostly unsupported…

Mathias Zarick came with the idea to ALTER DATABASE CLOSE in an AFTER STARTUP ON DATABASE to avoid the automatic open:

Active Data Guard's Real Time Query - avoid usage if not licensed

(I linked the archive.org here because at the time of writing the Trivadis blog it seems that the Trivadis blog does not exist anymore)

Then Uwe Hesse has mentioned a parameter which looks exactly like what we need: “_query_on_physical”

Parameter to prevent license violation with Active Data Guard

But there are many mentions that it is not recommended and not supported. It goes further than “undocumented”: the non-recommendation is itself well-documented (MOS note 2269239.1)

The real interesting supported thing is that, since 18c, we can now open the CDB and the Active Data Guard usage is not enabled as long as the user PDBs stay in mount.

18c: No Active Data Guard required (and detected) when only CDB$ROOT and PDB$SEED are opened in read-only - Blog dbi services

Here, the best is using Grid infrastructure or Oracle Restart to open the services (and then the PDB) correctly depending on the role.

For non-CDB, try to use SQLcl to run the startup, as this one does it in two steps (MOUNT+OPEN):

No risk to activate Active Data Guard by mistake with SQL Developer SQLcl

Ok, what is new then? Here is a small test to show how “_query_on_physical” does not help anymore.

Connected as SYSDG.
DGMGRL> show configuration
Configuration - cdb1
Protection Mode: MaxAvailability
Members:
cdb1a - Primary database
cdb1b - (*) Physical standby database
Fast-Start Failover: Enabled in Observe-Only Mode
Configuration Status:
SUCCESS (status updated 47 seconds ago)
DGMGRL> show database cdb1b
Database - cdb1b
Role:               PHYSICAL STANDBY
Intended State: APPLY-ON
Transport Lag: 0 seconds (computed 1 second ago)
Apply Lag: 0 seconds (computed 1 second ago)
Average Apply Rate: 7.00 KByte/s
Real Time Query: ON
Instance(s):
CDB1B
Database Status:
SUCCESS

this is an “Active Data Guard” configuration as mentioned by “Real Time Query: ON”.

I set the “_query_on_physical”=false and restart:

SQL> alter system set "_query_on_physical"=false scope=spfile;
System altered.
SQL> startup force
ORACLE instance started.
Total System Global Area 4.0668E+10 bytes
Fixed Size 30386032 bytes
Variable Size 5100273664 bytes
Database Buffers 3.5433E+10 bytes
Redo Buffers 103829504 bytes
Database mounted.
Database opened.
SQL> select open_mode from v$database;
OPEN_MODE
--------------------
READ ONLY
SQL> show pdbs
CON_ID CON_NAME                       OPEN MODE  RESTRICTED
---------- ------------------------------ ---------- ----------
2 PDB$SEED READ ONLY NO
3 PDB1 MOUNTED

So far so good, no Active Data Guard is in use here. Even better, if I try to open an PDB by mistake, it is not possible:

SQL> alter pluggable database all open;
alter pluggable database all open
*
ERROR at line 1:
ORA-10887: An Oracle Active Data Guard license is required to open a pluggable database while standby recovery is applying changes.
SQL> alter pluggable database all open read only;
alter pluggable database all open read only
*
ERROR at line 1:
ORA-10887: An Oracle Active Data Guard license is required to open a pluggable
database while standby recovery is applying changes.
SQL>
SQL> select open_mode from v$database;
OPEN_MODE
--------------------
READ ONLY
SQL>
SQL>
SQL> exit
Disconnected from Oracle Database 19c Enterpris

Now looking at the broker, “Intended State: APPLY-ON” and “Real Time Query: OFF” is the right configuration when you don’t have Active Data Guard and want the standby to be synchronized.

But:

[oracle@db193 ~]$ dgmgrl /
DGMGRL for Linux: Release 19.0.0.0.0 - Production on Thu Aug 1 06:28:02 2019
Version 19.4.0.0.0
Copyright (c) 1982, 2019, Oracle and/or its affiliates.  All rights reserved.
Welcome to DGMGRL, type "help" for information.
Connected to "CDB1B"
Connected as SYSDG.
DGMGRL> show configuration
Configuration - cdb1
Protection Mode: MaxAvailability
Members:
cdb1a - Primary database
cdb1b - (*) Physical standby database
Error: ORA-16810: multiple errors or warnings detected for the member
Fast-Start Failover: Enabled in Observe-Only Mode
Configuration Status:
ERROR (status updated 47 seconds ago)
DGMGRL> show database cdb1b
Database - cdb1b
Role:               PHYSICAL STANDBY
Intended State: APPLY-ON
Transport Lag: 0 seconds (computed 0 seconds ago)
Apply Lag: (unknown)
Average Apply Rate: (unknown)
Real Time Query: OFF
Instance(s):
CDB1B
Database Error(s):
ORA-16766: Redo Apply is stopped
Database Warning(s):
ORA-16854: apply lag could not be determined
Database Status:
ERROR

It seems that the apply is stopped.

And if I want to start it I get an error:

DGMGRL> edit database cdb1b set state=apply-on;
Error: ORA-16773: cannot start Redo Apply
Failed.

Here is the alert.log:

2019-10-09T13:46:01.619883+00:00
ALTER DATABASE RECOVER MANAGED STANDBY DATABASE CANCEL
2019-10-09T13:46:01.641127+00:00
Errors in file /u01/app/oracle/diag/rdbms/cdb1b/CDB1B/trace/CDB1B_rsm0_20946.trc:
ORA-16136: Managed Standby Recovery not active
ORA-16136 signalled during: ALTER DATABASE RECOVER MANAGED STANDBY DATABASE CANCEL...
2019-10-09T13:47:57.602491+00:00
RSM0: Active Data Guard Option is not enabled, Redo Apply Services cannot be started on an open database

Ok, so this is not what I wanted: not opened and no apply. Probably because this underscore parameter is not supported, it is not aware that we can have the CDB opened even without the option.

This is far too strict as now the APPLY is off and I cannot open the PDBs:

SQL> alter pluggable database all open read only;
alter pluggable database all open read only
*
ERROR at line 1:
ORA-10887: An Oracle Active Data Guard license is required to open a pluggable
database while standby recovery is applying changes.

only when I stop the broker I can issue an OPEN:

SQL> alter system set dg_broker_start=false scope=memory;
System altered.
SQL> alter pluggable database all open read only;
Pluggable database altered.

But…

SQL> show pdbs
CON_ID CON_NAME                       OPEN MODE  RESTRICTED
---------- ------------------------------ ---------- ----------
2 PDB$SEED READ ONLY NO
3 PDB1 MOUNTED

Nothing was opened…

SQL> alter pluggable database all open read only;
alter pluggable database all open read only
*
ERROR at line 1:
ORA-10887: An Oracle Active Data Guard license is required to open a pluggable database while standby recovery is applying changes.

But… it is not applying changes here.

Ok, now cleaning up this ugly parameter, starting manually and ensuring that all PDBS are closed before the broker starts:

alter system reset "_query_on_physical";
shutdown immediate;
startup mount;
alter system set dg_broker_start=false scope=memory;
alter database open read only;
alter pluggable database all close;
alter system set dg_broker_start=true scope=memory;

Everything is ok now. No PDB is opened in the standby:

SQL> show pdbs
CON_ID CON_NAME                       OPEN MODE  RESTRICTED
---------- ------------------------------ ---------- ----------
2 PDB$SEED READ ONLY NO
3 PDB1 MOUNTED

and the APPLY is running:

DGMGRL> show configuration lag;
Configuration - cdb1
Protection Mode: MaxAvailability
Members:
cdb1a - Primary database
cdb1b - (*) Physical standby database
Transport Lag: 0 seconds (computed 1 second ago)
Apply Lag: 0 seconds (computed 1 second ago)
Fast-Start Failover: Enabled in Zero Data Loss Mode
Configuration Status:
SUCCESS (status updated 20 seconds ago)

In summary: do not use this “_query_on_physical” parameter. Just be careful when opening pluggable databases and you are in a standby CDB. And if you are not (yet) in CDB, be careful with the “startup” command: use SQlcl or do the same (startup mount + alter database open read write) in two commands.

PostgreSQL subtransactions, savepoints, and exception blocks

$
0
0

TL;DR: similar syntax but very different transaction semantic between Oracle and PostgreSQL procedural blocks

I posted a tricky Quiz on Twitter (unfortunately forgot to mention explicitely that I have a unique constraint on DEMO1.N):

The trick is that I didn’t precise on which database I run that. And I used on purpose a syntax that is valid both for Oracle (with the anonymous block in PL/SQL) and PostgreSQL (with the anonymous block in PL/pgSQL).

A compatible syntax does not mean that the semantic is the same. That’s the common issue with people who think that it is easy to port a database application or build a database-agnostic application. You can speak the same language without understanding the same meaning. The specifications for each implementation goes beyond the apparent standard syntax.

Exception block with Oracle

https://dbfiddle.uk/?rdbms=oracle_18&fiddle=f0f4bf1c0e2e91c210e815d2ac67a688

db<>fiddle — Oracle 19c: https://dbfiddle.uk/?rdbms=oracle_18&fiddle=f0f4bf1c0e2e91c210e815d2ac67a688

The PL/SQL block runs within an existing transaction and the exception block has nothing to do with the transaction control. This is only about branching to another code path when an exception occurs.

Then, what was previously inserted is still visible in the transaction, and can be committed or rolled back.

Exception block in Postgres

https://dbfiddle.uk/?rdbms=postgres_12&fiddle=110d82eff25dde2823ff17b4fe9157d9

db<>fiddle — PostgreSQL 12: https://dbfiddle.uk/?rdbms=postgres_12&fiddle=110d82eff25dde2823ff17b4fe9157d9

Here, the PL/pgSQL block runs as an atomic subtransaction. And when an exception is trapped, the whole block is rolled-back before executing the exception block. Actually, the block that has an exception handler is run in a “subtransaction” which is nothing else than setting a savepoint at the begin and rollback to this savepoint when entering the exception block.

This, of course, is documented:

When an error is caught by an EXCEPTION clause, the local variables of the PL/pgSQL function remain as they were when the error occurred, but all changes to persistent database state within the block are rolled back.

In those examples, the exception handler did not raise any error. If I re-raise the error in the exception block, the be behavior is the same between Oracle and PostgreSQL: all changes done by the block (including the exception block) are rolled back.

Re-raise In PostgreSQL:

do $$
begin
insert into DEMO1 (n) values (1);
insert into DEMO1 (n) values (42);
exception when others then
insert into DEMO2 select * from DEMO1;
raise;
end;
$$ language plpgsql;

ERROR: duplicate key value violates unique constraint "demo1_n_key"
DETAIL: Key (n)=(42) already exists.
CONTEXT: SQL statement "insert into DEMO1 (n) values (42)"
PL/pgSQL function inline_code_block line 4 at SQL statement
select * from DEMO2;
n
---
(0 rows)

Re-raise in Oracle:

begin
insert into DEMO1 (n) values (1);
insert into DEMO1 (n) values (42);
exception when others then
insert into DEMO2 select * from DEMO1;
raise;
end;/
ORA-00001: unique constraint (DEMO.SYS_C0093607) violated
ORA-06512: at line 6
ORA-06512: at line 3
select * from DEMO2;
no rows selected.

More info about this behavior in Oracle from Stew Ashton:

Statement-Level Atomicity

Basically, in Oracle, the call to the stored procedure follows statement-level atomicity where an internal savepoint is set before any statement (SQL or PL/SQL) and an unhandled exception (including a re-raise exception) rolls back to it. That’s different in PostgreSQL where no savepoint is set implicitly, and the session has to rollback the whole transaction when an error occurs. The savepoint set before the PL/pgSQL block is only to rollback changes before executing the exception block.

Postgres transaction control and exception blocks

But, then what happens if we commit within the code block? It is then impossible to ensure that “all changes to persistent database state within the block are rolled back” because what is committed (made visible to others) cannot be rolled-back. And that’s the main goal of intermediate commits.

This impossibility is implemented with “ ERROR: cannot commit while a subtransaction is active” in spi.c:

https://github.com/postgres/postgres/blob/master/src/backend/executor/spi.c#L220

and all this is, of course, documented with a small statement in https://www.postgresql.org/docs/current/plpgsql-transactions.html:

A transaction cannot be ended inside a block with exception handlers.

The specifications for it is also mentioned in the “Transaction control in procedures” hackers thread started by Peter Eisentraut when proposing this feature:

Re: [HACKERS] Transaction control in procedures

Limitations

As I understand it, this restriction is there to keep the semantics of the subtransaction when an exception block is present. With a savepoint at BEGIN and a rollback to savepoint at EXCEPTION. This semantic specification predates the introduction of transaction control in procedures. However, new requirements to take full advantage of the transaction control in procedures have been raised by Bryn Llewellyn (currently YugaByteDB developer advocate, former Oracle PL/SQL product manager): https://github.com/yugabyte/yugabyte-db/issues/2464

These use-cases are about encapsulating the database calls in stored procedures that, then, expose only the microservice API. For security, performance, and portability this API must be database-agnostic, and then:

  • all RDBMS-specific error messages must be trapped and translated to business messages and/or system logs. This must be done in an exception block that also covers the commit-as the commit can fail.
  • serialization errors at commit must be re-tried on the server, and that must be done also with an exception block that covers the commit.

Another reason to commit in a procedure is during a large bulk operation where we want intermediate commits. We may want to trap exceptions in this case as well and to retry some operations in case of errors.

If I try to code the commit and the exception, the “cannot commit while a subtransaction is active” error is raised as soon as the “commit” statement is encountered, before even trying to execute it:

create table DEMO(
n integer primary key deferrable initially deferred
);
create or replace procedure my_test(n int) as $$
begin
insert into DEMO(n) values(n);
commit;
exception when others then
raise notice '%',sqlerrm;
end;
$$ language plpgsql;
CREATE PROCEDURE
call my_test(1);
NOTICE: cannot commit while a subtransaction is active
CALL

If I remove the commit, I can catch the exceptions, but then I must handle the commit error in the client:

create or replace procedure my_test(n int) as $$
begin
insert into DEMO(n) values(n);
--commit;
exception when others then
raise notice '%',sqlerrm;
end;
$$ language plpgsql;
CREATE PROCEDURE
call my_test(1);
CALL
call my_test(1);
ERROR: duplicate key value violates unique constraint "demo_pkey"
DETAIL: Key (n)=(1) already exists.

Here the error message does not come from the exception block, but from the end of the command, because I am in autocommit mode. This is more visible from an explicit transaction:

begin transaction;
BEGIN
call my_test(1);
CALL
commit;
ERROR: duplicate key value violates unique constraint "demo_pkey"
DETAIL: Key (n)=(1) already exists.

Evolution

I think that the “A transaction cannot be ended inside a block with exception handlers” specification should be adapted to procedures. In my opinion, a commit should be allowed, ending the subtransaction and starting a new one. What was committed will never be rolled back. When an exception is raised, only the changes since the last commit should be rolled back.

Discussion about this should probably go in this hackers thread:

Re: PL/pgSQL - "commit" illegal in the executable section of a block statement that has an exception section

improving performance with stored procedures — a pgbench example.

$
0
0

improving performance with stored procedures — a pgbench example.

In a previous post I mentioned that I do not use pgbench to benchmark the platform. But when it comes to measuring client/server application, pgbench fully makes makes sense.

I initialize the pgbench schema with small data:

pgbench - initialize - init-steps=dtgvpf -h localhost -p 5432 -U postgres franck

And I run the pgbench builtin workload with does something like a TPC-B

tpcb-like builtin

pgbench --builtin tpcb-like --transactions 30000 --protocol=prepared --jobs=10 --client=10 -h localhost -p 5432 -U postgres franck

I run 30000 transactions there, from 10 threads. It runs for more than 4 minutes:

The rate is 1097 transactions per second with an average of 9 milliseconds per transaction.

That’s my baseline. What the builtin transaction runs is easy to get from the source:

postgres/postgres

As pgbench can also run custom workloads, I’ll run exactly the same workload by copying those statements in a file.

tpcb-like as a custom file

Here is the file containing the same as the builtin found in pgbench.c:

cat > /tmp/tpcb-like <<'CAT'
-- tpcb-like <builtin: TPC-B (sort of)>
\set aid random(1, 100000 * :scale)
\set bid random(1, 1 * :scale)
\set tid random(1, 10 * :scale)
\set delta random(-5000, 5000)
BEGIN;
UPDATE pgbench_accounts SET abalance = abalance + :delta WHERE aid = :aid;
SELECT abalance FROM pgbench_accounts WHERE aid = :aid;
UPDATE pgbench_tellers SET tbalance = tbalance + :delta WHERE tid = :tid;
UPDATE pgbench_branches SET bbalance = bbalance + :delta WHERE bid = :bid;
INSERT INTO pgbench_history (tid, bid, aid, delta, mtime) VALUES (:tid, :bid, :aid, :delta, CURRENT_TIMESTAMP);
END;
CAT

Now running the workload from this file, still 30000 transactions from 10 threads.

pgbench --file /tmp/tpcb-like --transactions 30000 --protocol=prepared --jobs=10 --client=10 -h localhost -p 5432 -U postgres franck

The result is very similar:

The rate is 1095 transactions per second with an average of 9 milliseconds per transaction. Same statements and same throughput.

tpcb-like as a procedure + select

I create a stored procedure with all INSERT/UPDATE statements:

create procedure P_TPCB_LIKE
(p_aid integer, p_bid integer, p_tid integer, p_delta integer) AS $$
BEGIN
UPDATE pgbench_accounts SET abalance = abalance + p_delta WHERE aid = p_aid;
INSERT INTO pgbench_history (tid, bid, aid, delta, mtime) VALUES (p_tid, p_bid, p_aid, p_delta, CURRENT_TIMESTAMP);
UPDATE pgbench_tellers SET tbalance = tbalance + p_delta WHERE tid = p_tid;
UPDATE pgbench_branches SET bbalance = bbalance + p_delta WHERE bid = p_bid;
INSERT INTO pgbench_history (tid, bid, aid, delta, mtime) VALUES (p_tid, p_bid, p_aid, p_delta, CURRENT_TIMESTAMP);
END;
$$ language plpgsql;

Now, the custom file will only call that procedure for the modifications, and run the select:

cat > /tmp/simple-update-p <<'CAT'
-- tpcb-like <builtin: TPC-B (sort of)>
\set aid random(1, 100000 * :scale)
\set bid random(1, 1 * :scale)
\set tid random(1, 10 * :scale)
\set delta random(-5000, 5000)
BEGIN;
call P_SIMPLE_UPDATE(:aid, :bif, :tid, :delta);
SELECT abalance FROM pgbench_accounts WHERE aid = :aid;
END;
CAT

This is functionally equivalent and I run again the same number of transactions from the same number of threads:

pgbench --file /tmp/tpcb-like-p --transactions 30000 --protocol=prepared --jobs=10 --client=10 -h localhost -p 5432 -U postgres franck

Now I have a huge gain here as the throughput is 3 times higher:

The rate is 3024 transactions per second with an average of 3 milliseconds per transaction. Same statements but stored on the server.

tpcb-like as a function with refcursor

Ideally, each client/server call should be only one statement. And then I must include the SELECT part in my stored procedure. That is possible with a function that returns a refcursor:

create function F_TPCB_LIKE
(p_aid integer, p_bid integer, p_tid integer, p_delta integer) returns table(abalance integer) AS $$
DECLARE
c refcursor;
BEGIN
UPDATE pgbench_accounts SET abalance = pgbench_accounts.abalance + p_delta WHERE aid = p_aid;
INSERT INTO pgbench_history (tid, bid, aid, delta, mtime) VALUES (p_tid, p_bid, p_aid, p_delta, CURRENT_TIMESTAMP);
UPDATE pgbench_tellers SET tbalance = tbalance + p_delta WHERE tid = p_tid;
UPDATE pgbench_branches SET bbalance = bbalance + p_delta WHERE bid = p_bid;
INSERT INTO pgbench_history (tid, bid, aid, delta, mtime) VALUES (p_tid, p_bid, p_aid, p_delta, CURRENT_TIMESTAMP);
return query SELECT pgbench_accounts.abalance FROM pgbench_accounts WHERE aid = p_aid;
END;
$$ language plpgsql;

You note that I didn’t even change the variable names and for this reason, I prefixed abalance in the update statement.

Here is my simple call for the transaction, which does all the DML and returns a cursor:

cat > /tmp/tpcb-like-f <<'CAT'
-- tpcb-like <builtin: TPC-B (sort of)>
\set aid random(1, 100000 * :scale)
\set bid random(1, 1 * :scale)
\set tid random(1, 10 * :scale)
\set delta random(-5000, 5000)
BEGIN;
SELECT abalance from F_TPCB_LIKE(:aid, :bif, :tid, :delta);
END;
CAT

Running it with the same configuration:

pgbench --file /tmp/tpcb-like-f --transactions 30000 --protocol=prepared --jobs=10 --client=10 -h localhost -p 5432 -U postgres franck

the performance is even better:

The rate is 4167 transactions per second with an average of 2 milliseconds per transaction. Obviously this is better. The more you do in the database the better you can scale. But there’s even more: all the benefits from encapsulation. I’ll mention 3 main benefits:

  1. Here the API between the application and the database is independent of the SQL syntax. And the SQL statements that are tightly coupled with the data model (and the database system/version) are all encapsulated in the procedure, within this database.
  2. It is also a strong security advantage: no SQL injection possible as inputs go through the API which admits only a procedure name and typed parameters. And you can audit the procedure calls.
  3. When the junior architect tells you that your application is an ugly old monolith, add the following comment in front of each call to the stored procedures and you are trendy again:
--- calling the 'command' CQRS microservice
CALL my_app_procedure(...);
--- calling the 'query' CQRS microservice
SELECT my_app_function(...);

19c instant client and Docker

$
0
0

You should get there if you search for “ORA-12637: Packet receive failed” and “Docker”. Note that you can get the same error on old versions of VirtualBox and maybe other virtualized environments that do not correctly forward out-of-band data.

TL;DR: There are two workarounds for this:

  • get out-of-band correctly handled with a recent version of your hypervisor, or by disabling userland-proxy in Docker
  • disable out-of-band breaks usage by setting DISABLE_OOB=ON in sqlnet.ora (client and/or server)

But this post is also the occasion to explain a bit more about this.

Out Of Band breaks

You have all experienced this. You run a long query and want to cancel it. Sometimes, just hitting ^C stops it immediately. Sometimes, it takes very long. And that has to do with the way this break command is handled.

Here is an example where Out-Of-Band is disabled (I have set DISABLE_OOB=ON in sqlnet.ora):

09:55:44 SQL> exec dbms_lock.sleep(10);
^C
BEGIN dbms_lock.sleep(10); END;
*
ERROR at line 1:
ORA-01013: user requested cancel of current operation
ORA-06512: at "SYS.DBMS_LOCK", line 215
ORA-06512: at line 1
Elapsed: 00:00:06.02

Here is an example where Out-of-Band is enabled (the default DISABLE_OOB=OFF in sqlnet.ora):

10:13:05 SQL> exec dbms_lock.sleep(10);
^CBEGIN dbms_lock.sleep(10); END;
*
ERROR at line 1:
ORA-01013: user requested cancel of current operation
ORA-06512: at "SYS.DBMS_LOCK", line 215
ORA-06512: at line 1
Elapsed: 00:00:00.43

You see immediately the difference: with Out-Of-Band enabled, the cancel is immediate. Without it, it takes some time for the server to cancel the statement. In both cases, I’ve hit ^C at a time where the client was waiting for the server to answer a call. And that’s the point: when the client sends a user call it waits for the answer. And the server is busy and will not read from the socket until it has something to send.

Then here is how it works: on some platform (which explains why this ^C is not immediate when your client or server is Windows) the “break” message is sent with an Out-Of-Band channel of TCP/IP with the URG flag. Then, on the server, the process will be interrupted with a SIGURG signal and will be able to cancel immediately. Without it, this “break/reset” communication is done through the normal socket channel when it is available.

What is new in 19c

When the connection is established, the client checks that out-of-band break messages are supported, by sending a message with the MSG_OOB flag. This can be disabled by the new parameter: DISABLE_OOB_AUTO

But if the network stack does not handle this properly (because of bug in proxy tunneling or hypervisor) the connection hangs for a few minutes and then fails with: ORA-12637: Packet receive failed

Note that I don’t think the problem is new. The new connection-time check makes it immediately visible. But when OOB is not working properly a ^C will also hang. This means that setting DISABLE_OOB_AUTO=TRUE is not a solution but just postpones the problem. The solution is DISABLE_OOB which is there from previous versions.

ORA-12637: Packet receive failed

Here is what comes from strace on my sqlplus client trying to connect to my docker container using the forwarded port when using the default docker-proxy:

This, just after sending the MSG_OOB packet, is waiting 400 seconds before failing with ORA-12637. More about this 400 seconds timeout later.

Here is how I reproduced this:

  • I’m on CentOS 7.7 but I’m quite sure that you can do the same in OEL
  • I have Docker docker-ce-19.03.4
  • I installed Tim Hall dockerfiles:
git clone https://github.com/oraclebase/dockerfiles.git
  • I added Oracle 19.3 install zip into the software subdirectory :
ls dockerfiles/database/ol7_19/software/LINUX.X64_193000_db_home.zip
  • and apex:
ls dockerfiles/database/ol7_19/software/apex_19.1_en.zip
  • I build the image:
cd dockerfiles/database/ol7_19
docker build -t ol7_19:latest .
  • I installed 19.3 instant client:
wget https://download.oracle.com/otn_software/linux/instantclient/193000/oracle-instantclient19.3-basic-19.3.0.0.0-1.x86_64.rpm
wget https://download.oracle.com/otn_software/linux/instantclient/193000/oracle-instantclient19.3-sqlplus-19.3.0.0.0-1.x86_64.rpm
yum install -y oracle-instantclient19.3-basic-19.3.0.0.0–1.x86_64.rpm
yum install -y oracle-instantclient19.3-sqlplus-19.3.0.0.0–1.x86_64.rpm
  • Created some volumes:
mkdir -p /u01/volumes/ol7_19_con_u02
chmod -R 777 /u01/volumes/ol7_19_con_u02
  • and network:
docker network create my_network
  • and create a docker container based on the image, redirecting the 1521 port from the container to the host:
docker run -dit - name ol7_19_con \
-p 1521:1521 -p 5500:5500 \
- shm-size="1G" \
- network=my_network \
-v /u01/volumes/ol7_19_con_u02/:/u02 \
ol7_19:latest
  • Wait that the database is created:
until docker logs ol7_19_con | grep "Tail the alert log file as a background process" ; do sleep 1 ; done
  • Now if I connect from the host, to the localhost 1521 (the redirected one):
ORACLE_HOME=/usr/lib/oracle/19.3/client64 /usr/lib/oracle/19.3/client64/bin/sqlplus -L system/oracle@//localhost:1521/pdb1

I get ORA-12637: Packet receive failed after 400 seconds.

  • If I disable OOB, for example on the server:
docker exec -t ol7_19_con bash -ic 'echo DISABLE_OOB=ON > $ORACLE_HOME/network/admin/sqlnet.ora'

Then the connection is ok.

Note that if I disable DISABLE_OOB_AUTO=TRUE (the OOB detection introduced in 19c) the connection is ok but the client hangs if later I hit ^C

If I disable the docker-proxy then all is ok without the need to disable OOB (and I verified that ^C immediately cancels a query):

systemctl stop docker
echo ' { "userland-proxy": false } ' > /etc/docker/daemon.json
systemctl start docker
docker start ol7_19_con
docker exec -t ol7_19_con bash -ic 'rm $ORACLE_HOME/network/admin/sqlnet.ora'

The connection is ok and ^C cancels immediately.

Now about the 400 seconds, this is the connect timeout (INBOUND_CONNECT_TIMEOUT_LISTENER) set in this image:

oraclebase/dockerfiles

Tracing

I discussed this with the Oracle Database Client product manager and SQL*Net developers. They cannot do much about this except document the error, as the problem is in the network layer. I did not open an issue for Docker because I did not easily reproduce a simple send/recv test case.

What I’ve observed is that the error in docker-proxy came between docker version 18.09.8 and 18.09.9 and if someone wants to do a small test case to open a docker issue, here is what I traced in the Oracle InstantClient.

  • I trace the client + server + docker-proxy processes:
pid=$(ps -edf | grep docker-proxy | grep 1521 | awk '{print $2}')
strace -fyytttTo docker.strace -p $pid &
pid=$(ps -edf | grep tnslsnr | grep LISTENER | awk '{print $2}')
strace -fyytttTo oracle.strace -p $pid &
ORACLE_HOME=/usr/lib/oracle/19.3/client64 strace -fyytttTo sqlplus.strace /usr/lib/oracle/19.3/client64/bin/sqlplus -L demo/demo@//localhost/pdb1 </dev/null &

Here is the OOB checking from the client (sqlplus.strace) and sending other data:

13951 1573466279.299345 read(4<TCP:[127.0.0.1:54522->127.0.0.1:1521]>, "\0-\0\0\2\0\0\0\1>\fA\0\0\0\0\1\0\0\0\0-AA\0\0\0\0\0\0\0\0"..., 8208) = 45 <0.001236>
13951 1573466279.300683 sendto(4<TCP:[127.0.0.1:54522->127.0.0.1:1521]>, "!", 1, MSG_OOB, NULL, 0) = 1 <0.000047>
13951 1573466279.300793 write(4<TCP:[127.0.0.1:54522->127.0.0.1:1521]>, "\0\0\0\n\f \0\0\2\0", 10) = 10 <0.000033>
13951 1573466279.301116 write(4<TCP:[127.0.0.1:54522->127.0.0.1:1521]>, "\0\0\0\237\6 \0\0\0\0\336\255\276\357\0\225\0\0\0\0\0\4\0\0\4\0\3\0\0\0\0\0"..., 159) = 159 <0.000047>
13951 1573466279.301259 read(4<TCP:[127.0.0.1:54522->127.0.0.1:1521]>, "", 8208) = 0 <60.029279>

Everything was ok (last read of 45 bytes) until a MSG_OOB is sent. Then the client continues to send but nothing is received for 60 seconds.

On the server side, I see the 45 bytes sent and then poll() waiting for 60 seconds without nothing received:

13954 1573466279.300081 write(16<TCP:[4101540]>, "\0-\0\0\2\0\0\0\1>\fA\0\0\0\0\1\0\0\0\0-AA\0\0\0\0\0\0\0\0"..., 45 <unfinished ...>
13954 1573466279.300325 <... write resumed> ) = 45 <0.000092>
13954 1573466279.300424 setsockopt(16<TCP:[4101540]>, SOL_SOCKET, SO_KEEPALIVE, [1], 4 <unfinished ...>
13954 1573466279.301296 <... setsockopt resumed> ) = 0 <0.000768>
13954 1573466279.301555 poll([{fd=16<TCP:[4101540]>, events=POLLIN|POLLPRI|POLLRDNORM}], 1, -1 <unfinished ...>
13954 1573466339.297913 <... poll resumed> ) = ? ERESTART_RESTARTBLOCK (Interrupted by signal) <59.996248>

I’ve traces SQL*Net (later, so do not try to match the time):

2019-11-12 06:56:54.852 : nsaccept:Checking OOB Support
2019-11-12 06:56:54.853 : sntpoltsts:fd 16 need 43 readiness event, wait time -1
*** 2019-11-12T06:57:54.784605+00:00 (CDB$ROOT(1))
2019-11-12 06:57:54.784 : nserror:entry
2019-11-12 06:57:54.785 : nserror:nsres: id=0, op=73, ns=12535, ns2=12606; nt[0]=0, nt[1]=0, nt[2]=0; ora[0]=0, ora[1]=0, ora[2]=0
2019-11-12 06:57:54.785 : nttdisc:entry
2019-11-12 06:57:54.786 : nttdisc:Closed socket 16
2019-11-12 06:57:54.787 : nttdisc:exit
2019-11-12 06:57:54.787 : sntpoltsts:POLL failed with 4
2019-11-12 06:57:54.788 : sntpoltsts:exit
2019-11-12 06:57:54.788 : ntctst:size of NTTEST list is 1 - not calling poll
2019-11-12 06:57:54.788 : sntpoltst:No of conn to test 1, wait time -1
2019-11-12 06:57:54.789 : sntpoltst:fd 16 need 6 readiness events
2019-11-12 06:57:54.789 : sntpoltst:fd 16 has 2 readiness events
2019-11-12 06:57:54.790 : sntpoltst:exit
2019-11-12 06:57:54.790 : nttctl:entry
2019-11-12 06:57:54.790 : ntt2err:entry
2019-11-12 06:57:54.791 : ntt2err:soc -1 error - operation=5, ntresnt[0]=530, ntresnt[1]=9, ntresnt[2]=0
2019-11-12 06:57:54.791 : ntt2err:exit
2019-11-12 06:57:54.791 : nsaccept:OOB is getting dropped
2019-11-12 06:57:54.792 : nsprecv:entry
2019-11-12 06:57:54.792 : nsprecv:reading from transport...
2019-11-12 06:57:54.792 : nttrd:entry
2019-11-12 06:57:54.793 : ntt2err:entry
2019-11-12 06:57:54.793 : ntt2err:soc -1 error - operation=5, ntresnt[0]=530, ntresnt[1]=9, ntresnt[2]=0
2019-11-12 06:57:54.793 : ntt2err:exit
2019-11-12 06:57:54.794 : nttrd:exit
2019-11-12 06:57:54.794 : nsprecv:error exit
2019-11-12 06:57:54.794 : nserror:entry
2019-11-12 06:57:54.795 : nserror:nsres: id=0, op=68, ns=12535, ns2=12606; nt[0]=0, nt[1]=0, nt[2]=0; ora[0]=0, ora[1]=0, ora[2]=0
2019-11-12 06:57:54.795 : nsaccept:error exit
2019-11-12 06:57:54.795 : nioqper: error from niotns: nsaccept failed...
2019-11-12 06:57:54.796 : nioqper: ns main err code: 12535
2019-11-12 06:57:54.796 : nioqper: ns (2) err code: 12606
2019-11-12 06:57:54.796 : nioqper: nt main err code: 0
2019-11-12 06:57:54.797 : nioqper: nt (2) err code: 0
2019-11-12 06:57:54.797 : nioqper: nt OS err code: 0
2019-11-12 06:57:54.797 : niotns:No broken-connection function available.
2019-11-12 06:57:54.798 : niomapnserror:entry
2019-11-12 06:57:54.798 : niqme:entry
2019-11-12 06:57:54.798 : niqme:reporting NS-12535 error as ORA-12535
2019-11-12 06:57:54.799 : niqme:exit
2019-11-12 06:57:54.799 : niomapnserror:exit
2019-11-12 06:57:54.799 : niotns:Couldn't connect, returning 12170

The server process receives nothing for one minute (neither the OOB nor the normal data).

And here is the docker-proxy trace, copying the messages with splice() between the two sockets:

12972 1573466279.300434 splice(5<TCP:[172.18.0.1:55476->172.18.0.2:1521]>, NULL, 8<pipe:[4101550]>, NULL, 4194304, SPLICE_F_NONBLOCK <unfinished ...>
12972 1573466279.300482 <... splice resumed> ) = 45 <0.000028>
12972 1573466279.300514 splice(7<pipe:[4101550]>, NULL, 3<TCPv6:[::ffff:127.0.0.1:1521->::ffff:127.0.0.1:54522]>, NULL, 45, SPLICE_F_NONBLOCK <unfinished ...>
12972 1573466279.300581 <... splice resumed> ) = 45 <0.000051>
12972 1573466279.300617 splice(5<TCP:[172.18.0.1:55476->172.18.0.2:1521]>, NULL, 8<pipe:[4101550]>, NULL, 4194304, <unfinished ...>
12972 1573466279.300666 <... splice resumed> ) = -1 EAGAIN (Resource temporarily unavailable) <0.000032>
12972 1573466279.300691 epoll_pwait(6<anon_inode:[eventpoll]>, [], 128, 0, NULL, 2) = 0 <0.000016>
12972 1573466279.300761 epoll_pwait(6<anon_inode:[eventpoll]>, <unfinished ...>
12972 1573466279.300800 <... epoll_pwait resumed> [{EPOLLOUT, {u32=2729139864, u64=140263476125336}}], 128, -1, NULL, 2) = 1 <0.000028>
12972 1573466279.300836 epoll_pwait(6<anon_inode:[eventpoll]>, [{EPOLLIN|EPOLLOUT, {u32=2729139864, u64=140263476125336}}], 128, -1, NULL, 2) = 1 <0.000017>
12972 1573466279.300903 futex(0x55dc1af342b0, FUTEX_WAKE_PRIVATE, 1) = 1 <0.000021>
12972 1573466279.300963 splice(3<TCPv6:[::ffff:127.0.0.1:1521->::ffff:127.0.0.1:54522]>, NULL, 10<pipe:[4102384]>, NULL, 4194304, SPLICE_F_NONBLOCK <unfinished ...>
12972 1573466279.301007 <... splice resumed> ) = -1 EAGAIN (Resource temporarily unavailable) <0.000026>
12972 1573466279.301058 epoll_pwait(6<anon_inode:[eventpoll]>, <unfinished ...>
12972 1573466279.301096 <... epoll_pwait resumed> [], 128, 0, NULL, 2) = 0 <0.000025>
12972 1573466279.301128 epoll_pwait(6<anon_inode:[eventpoll]>, <unfinished ...>
12972 1573466279.301206 <... epoll_pwait resumed> [{EPOLLIN|EPOLLOUT, {u32=2729139864, u64=140263476125336}}], 128, -1, NULL, 2) = 1 <0.000066>
12972 1573466279.301254 splice(3<TCPv6:[::ffff:127.0.0.1:1521->::ffff:127.0.0.1:54522]>, NULL, 10<pipe:[4102384]>, NULL, 4194304, SPLICE_F_NONBLOCK <unfinished ...>
12972 1573466279.301306 <... splice resumed> ) = -1 EAGAIN (Resource temporarily unavailable) <0.000031>
12972 1573466279.301346 epoll_pwait(6<anon_inode:[eventpoll]>, [], 128, 0, NULL, 2) = 0 <0.000016>
12972 1573466279.301406 epoll_pwait(6<anon_inode:[eventpoll]>, <unfinished ...>
12972 1573466339.329699 <... epoll_pwait resumed> [{EPOLLIN|EPOLLOUT|EPOLLERR|EPOLLHUP|EPOLLRDHUP, {u32=2729139656, u64=140263476125128}}], 128, -1, NULL, 2) = 1 <60.028278>

I didn’t get further. The difference between Docker version 18.09.8 and 18.09.9 is also a difference of Go lang from 1.10.8 to 1.11.13 so there are many layers to troubleshoot and I wasted too much time on this.

The solution

Maybe the best solution is not trying to run Oracle Database in a Docker container. Docker makes things simple only for simple software. With such complex software as the Oracle Databases, it brings more problems.

For Docker, the best solution is to set the following in /etc/docker/daemon.json and restart docker:

{
"userland-proxy": false
}

This uses iptables to handle the port redirection rather than the docker-proxy which copies the messages with splice() which is a CPU overhead and adds latency, anyway.

For VirtualBox, there is a “ Network: scrub inbound TCP URG pointer, working around incorrect OOB handling” bug fixed in 6.0.12:

virtualbox.org

If you have no solution at network level, then you will need to disable Out-Of-Band breaks at SQL*Net level by adding DISABLE_OOB=ON in sqlnet.ora on the client or database (not the listener, the database one, and this does not need any restart). Then hitting ^C will be handled by in-band break where the server will have to stop at regular time and check for a break request.

Hi Chris,

$
0
0

Hi Chris,

>> How do you run automated tests for applications which depend on state of an Oracle database/schema?

Oracle Multitenant (no need for option and this may be done with free Oracle XE) can flashback a Pluggable DataBase very fast.

Of course, people would like to use the same technology for all components. But whether OS containers are good for the application server, it is not the right choice for a database instance (many processes with shared memory and persistent storage). With Multitenant, the CDB runs those processes and memory and can create/drop/flashback database containers which are the PDBs. Think about PDBs for data in the same ways as docker containers for software.

Franck.


kglLock()+1406

$
0
0

kglLock()+1406<-kglget()+293<-qostobkglcrt1()+498<-qostobkglcrt()+248<-qostobkglcrt2()+412<-qospsis()+2511 <-qospPostProcessIStats()+2765<-qerltFetch()+1544<-qerstFetch()+449<-insdlexe()+364<-insExecStmtExecIniEngine()+1810<-insexe()+2283<-atbugi_update_global_indexes()+1656<-atbFMdrop()+3088<-atbdrv()+7719

Sorry for this title, but that’s exactly the subject: this short stack gives me enough information to understand the issue, reproduce it, open a SR, talk with friends, find a workaround,…

A Friday afternoon story

Here is how this started, on a database just migrated from 11g:

Every hour a job is running, many sessions are blocked on library cache lock. As we are in RAC 19c, The Hang Manager detects this blocking situation and kills the culprit after a while. This was the first time I see it in action in real life. Killing is never good, but that’s better than letting all sessions blocked by one background job. However, it does not resolve the root cause… which, in this case, comes back every hour.

I was on day-off, but I can’t resist looking at those things. I look at the trace file. Not only the Hang Manager kills the blocking session but also dumps a lot of diagnostic information. Finding the needle in a haystack is not so difficult once you have identified where is the haystack: the dump trace contains the call stack which identifies where the issue occurs — which C function in Oracle software. And it also gives some clues about the context and how we got there.

I shared this call stack just in case some friends already encountered this issue:

Now let’s see how I came, within a few minutes, to the idea that it was related to online statistics gathering and global index maintenance. The best source of information about Oracle C function is Frits Hoogland www.orafun.info and you can even copy/paste the stack trace as-is in http://orafun.info/stack/

If the full function is not found here, you can guess from the names, you can search My Oracle Support for bugs related to this function,… and this is what I came with:

  • the hang situation was detected in kglLock(): kernel generic library cache management library cache lock, which is already known as the wait was on “library cache pin”
  • qospsis() is query optimizer statistics related to setting index statistics. That’s interesting. I can also see a call to the statement I’ve seen in the dump trace: dbms_stats.postprocess_indstats(). This is a new feature in 19c where online statistics gathering happens for indexes as well as tables. But, as far as I know, this should occur only on direct-path insert.
  • qospPostProcessIStats() confirms this: setting the index statistics is part of post processing index statistics
  • qerltFetch() is query execute rowsource load table fetch and qerstFetch() is query execute rowsource statistics row source fetch. That looks like an insert from select.
  • insdlexe() is insert direct load execution. This links to the online statistics gathering: direct-path inserts counting inserted rows to set index statistics at the end.
  • atbugi_update_global_indexes() makes the link between indexes and the statement causing this because atb is the prefix for ALTER TABLE functions.
  • atbFMdrop() on google finds a bug about “ORA-600 Hit When Drop of Table Partition” — I’ve no idea why but “FM” looks like related to partitions and we are dropping one. Yes, I found an ALTER TABLE DROP PARTITION in the waiting session cursor for the job that kicks-in every hour.

Ok, that’s far from understanding everything but at least we have a consistent view about what happened: We drop a partition. This has to update global indexes. By some magic, this is done in direct-path. In 19c direct-path does update the index statistics. And probably a bug there leads to a deadlock situation. Note that I’ve no global indexes on this table, but the codepath is there.

1. Workaround to fix the production issue

Thanks to the function name where the problem occurs, I have my workaround 😀. I’ve just migrated to 19c. I don’t rely on the online statistics gathering. Let’s disable it. I did it first with “_optimizer_gather_stats_on_load”. It was the first coming out of my mind, but after a while, as suggested by Oracle Support, we did it more precisely by disabling only “_optimizer_gather_stats_on_load_index”.

Yes, being able to workaround a critical production issue on Friday afternoon is the best you can do to a DBA.

2. Testcase to open a SR

The full call stack helps to reproduce the situation. I can create a partitioned table, create global indexes (I finally realized that I don’t even need to have GIDXs), drop a partition, and observe the behavior. But… wait. In 19c the index maintenance is supposed to be asynchronous. It was not like this on my production issue because I can see this in the trace:

insert /*+ RELATIONAL("...") NO_PARALLEL APPEND NESTED_TABLE_SET_SETID NO_REF_CASCADE */ into "..."."..." partition ("P1") select /*+ RELATIONAL("...") NO_PARALLEL */ * from NO_CROSS_CONTAINER ( "..."."..." ) partition ("...") delete global indexes

All ingredients are there in this magic internal query: direct path insert to delete the global index entries related to the dropped partition. But looking for this “delete global indexes” in My Oracle Support shows that this is the old pre-12c behavior when index maintenance was immediate. I don’t know what prevents this new feature in my case but that also explains the highest probability for a new bug: the two features (online statistics gathering and asynchronous GIDX maintenance) are usually not found together as one was pre-12c and the other is 12c.

But now, I can simulate the same thing for my test case with the parameter that controls this async GIDX update: “_fast_index_maintenance”=false. Again, this is mentioned in the MOS notes and easy to guess from its name.

Here is the simple test case that reproduces this improbable situation:

create table DEMO (a primary key,b not null)
partition by range (a) (partition p1 values less than(5),partition p2 values less than (maxvalue))
as select rownum,rownum from xmltable('1 to 10')
/
create index DEMO_B on DEMO(B) global;
alter session set "_fast_index_maintenance"=false;
alter table DEMO drop partition for(1) update global indexes;

This self-deadlocks even in single-instance (solved differently but on the same cause) and in the latest release update. Now I have everything to open an SR.

The message from this post

I’ve written this to give some positive messages about things that may have a bad reputation.

The blocking issue in production was limited thanks to:

  • Hang Manager, one component of this complex Grid Infrastructure software is there to detect the hanging situations and reduce their consequences by killing the blocker. And dump diagnostic information. In the old times, I’ve seen many people “solving” this with a “startup force” and even forgetting to dump a hang analysis.

I got a quick workaround thanks to:

  • the comprehensive diagnostic capabilities of the Oracle Database Software (one dump with statements, wait events, call stack,…)
  • the amazing community of people doing research and sharing their results (like Frits Hoogland documenting the internal functions, or Tanel Poder troubleshooting tools and methods… can’t name all of them)
  • the My Oracle Support engineers who build an easy-to-search knowledge base. That’s the invisible part of commercial software support: maybe spend more time on one customer issue in order to gather enough information to help the many other customers who will be in the same case.

I got a reproducible test case thanks to:

  • the free environment (OTN license, Free Tier Cloud,…) that Oracle provides to us. I can ssh to my lab VM from anywhere.
  • the Oracle Software keeping symbols in the executable to make the call stack understandable. It is not Open Source. You cannot recompile with more debug info. But you don’t need to: they are all there.
  • the lessons I learned from Tom Kyte or Jonathan Lewis in order to think about small test cases to show a problem.

I can get further in understanding thanks to

  • the product managers who follow those issues in the shadow
  • the Oracle User Groups and ACE program which put in contact the users, the PMs, the developers,…

And long term fixes thanks to

  • the Oracle developers who have identified this improbable but in some regression testing and already fixed it for future versions
  • support who will probably backport the fix in future Release Updates (no need for one-off when a workaround is possible)

We complain a lot about what doesn’t work and I thought it was a good idea to describe this. There’s no magic bug-free software. What makes the difference is how they are instrumented for troubleshooting, and how they build a community to help users.

A small management summary

Some managers think that the budget they put on buying software and support is sufficient to get their infrastructure running their business. But that’s not enough to avoid bugs and find fixes for critical situations. It is only a little additional effort to get to this point: send people to conferences, give them time to learn, to share, to read, to post, to publish and to discuss. This is what will make the difference one day. Forget this “no human labor” and “eliminate human errors” which is chanted by software vendor salespeople just because this is the music you want to hear. Unexpected situations always happen. One day, the software you use will have a problem. Your business will be blocked. Machines can help to diagnose, but it will be a human who will find, with other humans help, how to get the service available again.

Finding the deleted TYPE when ANYDATA raises ORA-21700: object does not exist or is marked for…

$
0
0

Finding the deleted TYPE when ANYDATA raises ORA-21700: object does not exist or is marked for delete

The current message about Oracle Database is: multi-model database. That’s not new. At the time of Oracle 9i, Object Oriented was the trend, with all the flexibility of polymorphism, but without the mess of unstructured data and without the inconsistency of NoSQL. Oracle added a datatype that can contain any datatype: SYS.ANYDATA. In the same column, you can put a number in row 1, a varchar2 in row 2, a record in row 3, andy object in row 4… Any arbitrary object can be stored, but, unlike a RAW or a BLOB (or XML or JSON), each object is structured and references a known datatype or a user-created TYPE.

However, it is impossible to enforce the dependency for each row and it can happen that you DROP a TYPE that is used by an ANYDATA object.

Example

I create two types. Very simple ones, and similar for this example, but it can be any complex object definition:

DEMO@//localhost/pdb1> create type DEMO1 as object(a number);
2 /
Type created.
DEMO@//localhost/pdb1> create type DEMO2 as object(a number);
2 /
Type created.

I create a table with a key (NUMBER) and value (ANYDATA):

DEMO@//localhost/pdb1> create table DEMO ( k number, v anydata );
Table created.

I insert two instances of DEMO1

DEMO@//localhost/pdb1> insert into DEMO values(1, 
anydata.convertobject( DEMO1(1)) );
1 row created.
DEMO@//localhost/pdb1> insert into DEMO values(2,
anydata.convertobject( DEMO1(1)) );
1 row created.

and two instances of DEMO2

DEMO@//localhost/pdb1> insert into DEMO values(3,
anydata.convertobject( DEMO2(1)) );
1 row created.
DEMO@//localhost/pdb1> insert into DEMO values(4, 
anydata.convertobject( DEMO2(1)) );
1 row created.

Type name and Dump

I query the table. SQL Developer displays the type but I can also get it with ANYDATA.GETTYPENAME()

select k,v,anydata.getTypeName(v) from demo;

By curiosity, I look at the binary storage:

select k,anydata.getTypeName(v),substr(dump(v,16),1,145) from demo;

This contains the Type Object ID. Here are my types from USER_TYPES:

select * from user_types;

On this example it is clear that the TYPE_OID is there:

99ED99CFEAB04E7FE0531103000A3EA6 is contained in Typ=58 Len=74: 0,1,0,0,0,0,0,1,0,0,0,19,83,df,0,34,48,90,0,2e,0,0,2a,1,85,1,2a,1,1,2,4,0,6c,99,ed,99,cf,ea,b0,4e,7f,e0,53,11,3,0,a,3e,a6,0,1,0,0,

99ED99CFEAB44E7FE0531103000A3EA6 is contained in Typ=58 Len=74: 0,1,0,0,0,0,0,1,0,0,0,19,83,e2,0,34,48,90,0,2e,0,0,2a,1,85,1,2a,1,1,2,4,0,6c,99,ed,99,cf,ea,b4,4e,7f,e0,53,11,3,0,a,3e,a6,0,1,0,0,

Drop the TYPE

Now, I can drop the TYPE without having any error:

drop type DEMO2;

This is not a bug (Bug 14828165 : TYPE IS ALLOWED TO BE DROPPED closed in status 92). With ANYDATA you want flexibility, right?

However, I cannot query a value that references this dropped TYPE:

select * from demo
*
ERROR at line 1:
ORA-21700: object does not exist or is marked for delete

And the problem is that I cannot even know the type name:

select k,anydata.getTypeName(v) from demo;

The only thing that I can see is the Type OID from the dump of the ANYDATA value:

But as the TYPE was dropped, I cannot get the name from USER_TYPES.

Flashback query

Ideally, you can get this metadata information from a Data Pump export (OID is visible in the DDL sqlfile) or from a backup. Here, as the DROP was recent, I’ll simply use Flashback Query.

I cannot “versions between” on a view so I query first the SCN from TYPE$

select toid,versions_endscn,versions_operation
from sys.type$ versions between scn minvalue and maxvalue
where ',99,ed,99,cf,ea,b4,4e,7f,e0,53,11,3,0,a,3e,a6,0,1,0,0,'
like '%,'||regexp_replace(dump(type$.toid,16),'^.* ')||',%'
;

(I passed through a regexp because SQL Developer adds thousand separators which made their way to the substitution variable)

And then I query “as of” the DBA_TYPES for this SCN to get all information:

select *
from dba_types as of scn ( 11980082 -1)
where rawtohex(type_oid)= '99ED99CFEAB44E7FE0531103000A3EA6'

Here I have it: the dropped type referenced by this ANYDATA value is DEMO.DEMO2 and that can help me understand what it was and when it has been dropped. As long as I am in the UNDO retention I can find all information to recreate it (mentioning the OID).

I’ve put all that in a function which takes the ANYDATA value and DUMP() to find the OID and name when the ORA-21700 is encountered:

with function try(x anydata,d varchar2) return varchar2 as
l_toid varchar2(1000); l_scn number; l_name varchar2(1000); begin return anydata.getTypeName(x); exception when others then select rawtohex(toid),versions_endscn into l_toid,l_scn from sys.type$ versions between scn minvalue and maxvalue where d like '%,'||regexp_replace(dump(type$.toid,16),'^.* ')||',%' order by versions_endscn fetch first 1 rows only; select owner||'.'||type_name into l_name from dba_types as of scn (l_scn -1) where rawtohex(type_oid)=l_toid; return sqlerrm||' -> '||l_name; end; select k,try(v,dump(v,16)) from demo.demo /

Basically, ANYDATA stores all known datatypes in their own format, in a record, with an OID to reference the structure metadata. Here is an example where the NUMBER format is visible inside:

Who says that there is an impedance mismatch between Relational Databases and Object Oriented models? There are not. You can store objects in a relational database. But there are only a few use cases where you want a column with a generic datatype where you can store ANYDATA. For example, Advanced Queuing uses that for queued messages: you know what you put. You know what you read. But the table can store heterogeneous data without having to define one table queue for each type. Yes, this looks like inheritance and abstract class, in a relational table.

3 months after the Oracle “Always Free” Tier — unexpected termination.

$
0
0

3 months after the Oracle “Always Free” Tier — unexpected termination. But don’t panic.

3 months ago, when Larry Ellison announced the “Always Free Tier”, I posted a blog about its possibilities and limitation:

The Oracle Cloud Free Tier

I used the ATP, ADW, and compute instances that I’ve created during that time and then did not expect any termination. But exactly 3 months later, the service is not available.

Autonomous Database

About the Autonomous Databases, I got the same as Dani Schider:

I can’t connect with SQL Developer Web

I can’t connect with sqlplus:

But the Service is up.

Fortunately, nothing is lost: I just re-start the service and my data is there.

Perfect. The last login was on December 18th at midnight as I run this from my free tier VM to keep the databases up:

00 00 * * * TNS_ADMIN=/home/opc/wallet sqlplus -s -L demo/"**P455w0rd**"@atp1_low >/tmp/atp1.log <<<'select banner,current_timestamp from v$version;'
00 00 * * * TNS_ADMIN=/home/opc/wallet sqlplus -s -L demo/"**P455w0rd**"@adw1_low >/tmp/adw1.log <<<'select banner,current_timestamp from v$version;'

Oh, but talking about the compute instance, they are down as well:

Compute Instance

I received this notification which proves that:

  • this problem was not expected
  • the free tier is still considered as production

Ok, really cool that they “are currently working to restore the instance(s) on your behalf.” but the procedure is simple. The instances were terminated but the boot volume is still there. I follow the procedure metioned:

Compute > Boot Volumes

The name is easy to find: “A (Boot Volume)” is the boot volume for the instance “A” that was terminated:

It is also the occasion to clean-up the mess I left: the two first “always free” I created are still there even if I’ve terminated the instance.

Create Instance

From the context menu on the boot volume, just click “Create Instance”

Don’t forget to mention the name if you want the same as before

Public network

Do not forget by the default is no interface on the public internet. Click on “Show Shape”, go to “Network and Storage Options” and select the “Public subnet”

Don’t forget to click on “Assign a public IP address”. You will have a new IP address, so don’t forget to change anything that referred to it.

But I can check that I’ve not lost anything:

The last sign of life is in /var/log/secure was at Dec 18 03:14:28 when a user “fulford” tried to ssh from Shangai… so the server probably crashed around that time.

Finally all good

We were notified about the problem, with the simple way to recover and no data was lost, so no big damage. But if you relied on an 24/7 up service then some manual intervention (“human labor” ;) is required to get the service up and change the IP addresses. Remember that it is a free service and “you get what you pay for”…

Sharing my screen to the web (from Oracle free tier compute instance) using tmux and gotty

$
0
0

Sharing my screen to the web (from Oracle free tier compute instance) using tmux and gotty

For a long time, I use tmux for my live demos because I can multiplex my screen between my laptop and the beamer, I can show several panes, and I can script my commands using send-keys. I also use tmux to keep a stateful work environment which I run on my Oracle Cloud always free tier Compute Instance, which is 100% free and 100% available, and 100% accessible

  • 100% because even if you need to create a trial account with your credit card it is never charged and the free tier remains after the 30 days trial
  • 100% available because you never have to shut it down and it will never be terminated as long as it was used in the last 3 months (there was a bug recently but was quickly solved even if the free tier has no support)
  • 100% accessible because you can ssh from the internet, and your private key gives you access to the opc user that can sudo to root.

Here I’ll describe what I did to get further in sharing my screen. TMUX can share by attaching clients, which means open a new tty, ssh to the host, and run “tmux attach”. But in case there is any problem with the beamer, or if the screen is too large, I want a simple solution for attendees to see my screen on their laptop or tablet, in a web browser. I need two thins for that: open the port for http access and use gotty to run a tmux session in read-only.

Open a TCP port to the internet

I’ll share my screen on the port 12345 and I need first to open in on the host:

sudo iptables -I INPUT 5 -i ens3 -p tcp --dport 12345 -m state --state NEW,ESTABLISHED -j ACCEPT

Then on my network, I add this port in addition to SSH access from public network:

I follow this path: Compute Instance -> VCN Details -> Security List -> Default Security List -> Add Ingress Rule -> Source CDR = 0.0.0.0/0 and destination port = 12345

Compute Instance -> VCN Details -> Security List -> Default Security List -> Add Ingress Rule -> Source CDR and destination port

Here it is, the world wide web has access to my network on port 12345 and now I have to listen to it. I’ll use:

gotty

yudai/gotty

I download the latest version to my opc home dir:

wget -O- https://github.com/yudai/gotty/releases/download/v1.0.1/gotty_linux_amd64.tar.gz | tar -C ~ -zxvf -

I define a basic configuration file:

cat > ~/.gotty <<-CAT
preferences {
font_size = 14
background_color = "rgb(42, 42, 42)"
}
CAT

I generate a certificate if I want to enable TLS later:

openssl req -x509 -nodes -days 9999 -newkey rsa:2048 -keyout ~/.gotty.key -out ~/.gotty.crt <<stdin
CH
Vaud
Lausanne
pachot.net
franck
$(hostname)
hello@pachot.net
stdin

And I can now run something to test it:

./gotty --port 12345 top -c 

which logs the following

I connect to my host:port (the IP address from the public network is the same used to ssh — not the one displayed by gotty here) from my browser and can see a terminal with “top -c” running:

That’s perfect. gotty has logged my connection:

tmux

As I use this to share my tmux screen, I add the following in .tmux.conf to start a tmux attach to the current tmux session through gotty, binding this to ^T here:

grep "gotty" ~/.tmux.conf || cat >> ~/.tmux.conf <<'CAT'
# gotty https://github.com/yudai/gotty
bind-key C-t new-window -P -F "screen shared on: http://12345.pachot.net" "TMUX= ~/gotty --port 12345 --title-format "@FranckPachot" --width $(( 0 + `tmux display -p '#{window_width}'` )) --height $(( 4 + `tmux display -p '#{window_height}'` )) --reconnect tmux attach -r -t `tmux display -p '#S'`"
CAT
  • --port defines the port to listen to (opened in iptables and in VCN)
  • I use tmux variables #{window_width} and #{window_height} to get the same number of columns and lines (width and height) because tmux resizes in all clients to fit the smallest one.
  • --reconnect tries to reconnect every 10 seconds if connection is lost
  • tmux attach -r (read-only as additional security but gotty starts in read-only by default). I unset TMUX variable as it is not a nested session.

Now when I am on TMUX, I can C-B C-T to open a window that runs gotty and attach to my current session. Then I just have to share the url and people can see my screen on their screen.

Here is my browser and my tty:

(this is an answer to Jeff Potter —  “3 Reasons I Hate Booleans In Databases”)

$
0
0

(this is an answer to Jeff Potter — “3 Reasons I Hate Booleans In Databases”)

I’ll start with the “benchmark” because I like facts.

Testcase

Here is your test which I ran on less number of rows (because it is not needed and easier to run and share from db<>fiddle) and I’ve run the queries once before in order to warm-up the cache. And I displayed the execution plan to get better understanding about the response time:

https://dbfiddle.uk/?rdbms=postgres_12&fiddle=d6e7789dfca6e314cc741f16573b030c

What you did here by replacing the 2-state boolean with a N-state timestamp is that you completely confused the query planner heuristics. Look at the second execution plan: 489 rows estimated instead of 49940. And then the optimizer choose a different plan which is not optimal here (220.956 seconds instead of 27.429)

Now, run the same with an analyze so that the cost based optimizer has more info about the number of nulls in your column. You overload the statistics metadata with many unneeded timestamps but at least the estimation is ok:

https://dbfiddle.uk/?rdbms=postgres_12&fiddle=37849052cbf703e83ad53063a3db6c57

Now the estimation is fine and if you go to the db<>fiddle you can see why: the “null_frac” in “pg_stat” shows how many nulls you have. You can see the many “most_common_vals” that are now stored in the dictionary. And they will probably never be useful as your goal is to query on nulls or not nulls only.

Now that you have a correct execution plan you can see that it is exactly the same for your two queries: full table scan, which is the most efficient when reading 50% of the rows. No need to compare the response time: it is exactly the same amount of work done.

A better test would test on two different tables. And vacuum them as in real life you don’t expect 100% rows out of the visibility map. You will see an Index Only Scan and there, of course, very little difference. But anyway, this is not the model you expect in real life. You will probably never create a full index on one boolean column only. Either you want quick access to the few flagged rows, and that’s a partial index. Or you will just combine this boolean column in addition to other columns where you have a selective predicate.

lack critical information

Your physical data model has to store what you need, all what you need, and only what you need. There’s nothing like a generic domain model when going to platform-specific implementation. Your data model is designed for your use-cases. If you have a “Persons” table and you want to know who is married or not, you add this information as a boolean because that’s what you asked to your the user: “check the box if you are married”. You do not store their wedding date (which is actually the timestamp related to the state). And if you want to know when they entered this information, then you have probably a “last_modification” column for the whole record. And anyway, the database stores the state history (for recovery purpose) and can store it automatically for business purposes (triggers, temporal tables,…).

If you need this information, either you rely on what the database provides or you log/audit them. Like what you mention with “state transition logging”. But not for each column and each boolean! If you go that way, then what is the rationale behind storing a timestamp with “ User.is_email_confirmed” and not with “ User.email” to know when they changed their e-mail?

There is overhead everywhere by replacing a simple “True” by a timestamp. The optimizer statistics above was just an example. Think about CPU cycles needed to test a boolean vs. a datatype with calendar semantic. Think about the space it takes in a row, which can then cross the limit where data stays in cache or not (for all levels of cache).

By the way, a boolean can be nullable, which means that it can have 3 values. You may want to store the information that you don’t know yet if the value is true or false. By replacing it with a timestamp, you pervert the semantic of NULL: rather than indicating the absence of value, it now holds the value “False”.

poorly conceived state machines

Your third point is about the data model. Yes, from the relational theory point of view the need for a boolean datatype can be discussed. The boolean state should be implemented by the presence of a row in a fact table. Your first example about “User.is_email_confirmed” should probably go to a table that logs the confirmation (with a timestamp, maybe the IP address of the sender, …). But beyond the theory, let’s be pragmatic. One day, for legal reasons (like GDPR) you will have to remove this logged information and you will still need a boolean to replace what you removed. The boolean then is derived information required in the physical data model for implementation reasons.

Of course, if you need more values, like “Created -> Pending -> Approved -> Completed” in your example, you need another datatype. You suggest a NUMBER but you don’t actually need number semantic (like doing arithmetic on them). It can be a CHAR but you don’t need character semantic (like character set). The best solution depends on the database you use. PostgreSQL has an ENUM datatype. The most important if you use a CHAR or NUMBER is to have a check constraint so that the optimizer knows the valid values when estimating the cardinalities.

Finally

The funny thing is that I’m not advocating for boolean datatypes at all here. I’ve been working 20 years on Oracle which does not have boolean columns and I never have seen the need for it for a table column. A CHAR(1) NOT NULL CHECK IN(‘Y’,’N’) is ok for me. The problem comes with views and resultsets because you need to define the correspondence with the database client program. But Oracle provides PL/SQL to encapsulate database services in stored procedures, and this has booleans (and many non-relational data types).

And sorry for the long answer but I didn’t want to just add a “I disagree on all” without explanation ;)

Viewing all 515 articles
Browse latest View live


<script src="https://jsc.adskeeper.com/r/s/rssing.com.1596347.js" async> </script>